
- Title
-
Ethanol exposure disrupts extraembryonic microtubule cytoskeleton and embryonic blastomere cell adhesion, producing epiboly and gastrulation defects
- Authors
- Sarmah, S., Muralidharan, P., Curtis, C.L., McClintick, J.N., Buente, B.B., Holdgrafer, D.J., Ogbeifun, O., Olorungbounmi, O.C., Patino, L., Lucas, R., Gilbert, S., Groninger, E.S., Arciero, J., Edenberg, H.J., and Marrs, J.A.
- Source
- Full text @ Biol. Open

Ethanol exposure reduces epiboly progression and dorsal forerunner cell aggregation. (A–F) Live embryos at 50% epiboly (A,B), shield (C,D), and 80% epiboly stages (E,F) showed reduced epiboly progression in the ethanol treated embryos (B,D,F) compared to control (A,C,E). (G,H) In situ hybridization depicting ntl showed epiboly delay in the deep cells and obvious separation of the dorsal forerunner cells from the deep cell margin in the ethanol treated embryo (H). Black lines with arrows indicate the distance between the deep cell margin and the animal pole. White arrows: dorsal forerunner cells. (I,J) 3D renderings of confocal microscopy optical sections of phalloidin stained (F-actin) gastrulae. Yellow arrowhead: deep cell margin; yellow perforated line: EVL margin. (K,L) 3D renderings of confocal microscopy optical sections of TO-PRO-3 stained embryos showed deep cells nuclei, EVL cell nuclei and YSL nuclei. Yellow arrowhead: deep cell margin; yellow perforated line: EVL margin drawn from F-actin staining (I,J); white line: yolk syncytial nuclei margin. (M,N) High magnification images of control and ethanol treated embryos highlighting cell boundaries of a few EVL cells. Cells at the embryo margins in the control embryo showed elongated EVL cells, roughly perpendicularly aligned to the EVL margin (M). Ethanol treated embryos showed rounder and not correctly aligned EVL cells (N). Yellow asterisk indicates big multinucleated cell. (O,P) High magnification images of the TO-PRO-3 stained control and ethanol treated embryos. Control embryos showed YSL nuclei proceeded beyond the EVL (O). Ethanol treated embryos showed fewer YSL nuclei proceeded beyond the EVL. EXPRESSION / LABELING:
PHENOTYPE:
|
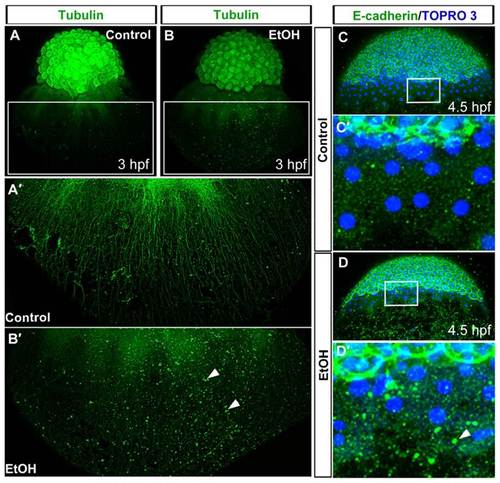
Ethanol exposure disrupts yolk cell microtubule and E-cadherin distribution. (A,B) 3D renderings of confocal microscopy optical sections of anti-α-tubulin antibody stained embryos showed microtubule organizations in the control (A) and ethanol treated (B) embryos at 3hpf. (A′,B′) High magnification image of the boxed regions of embryos showed arrays of yolk cell microtubule extending toward the vegetal pole in the control (A′) and abnormal arrays of yolk cell microtubules in the ethanol treated embryo (B′). Arrowheads indicate aggregates of α-tubulin in the yolk cell. (C–D′) 3D images of confocal microscopy optical sections of anti-E-cadherin antibody stained embryos showed E-cadherin distribution in the control (C) and ethanol treated (D) embryos at 4.5hpf. High magnification image of the boxed region of the control embryo showed relatively small aggregates of E-cadherin in the yolk cell (C′) than ethanol treated embryos, which had large aggregates of E-cadherin in the yolk cell (D′). Arrowhead indicates large E-cadherin aggregate. PHENOTYPE:
|

Ethanol exposure affects radial intercalation and gastrulation cell movements. (A,B) Confocal microscopy optical sections from the time-lapse image sequences at the most external epiblast layer of FITC-labeled histone-1 injected control (A) and ethanol (B) treated embryos at 4.5hpf. Solid white line highlights representative cells in the upper layer, dotted line indicates cell in the lower layer. (C,D) Schematic diagrams illustrating radial intercalation (RI) events in the control (C) and ethanol treated (D) embryos. Unlike control, ethanol treated cells showed lamellipodia extension in all directions. (E) Histogram showing RI events in the control and ethanol treated embryos. (F,G) The paths of ten deep cells in the mesendoderm of control and ethanol treated embryos. Cells in ethanol treated embryos showed abnormal trajectories. Animal pole, top; vegetal pole, bottom. PHENOTYPE:
|

Ethanol treatment reduces blastomere adhesion, but E-cadherin expression and distribution were only minimally affected. (A) Cell adhesion assay using dissociated cells blastomeres. Graph showed cell-to-cell aggregation (object-to-cell ratios) of the dissociated control and ethanol treated blastomeres, which was reduced in ethanol treated cells. (B,C) Single confocal microscopy optical sections of the phalloidin stained prechordal plate cells in control and ethanol treated embryos at 8hpf. (D,E) Single confocal microscopy optical sections showed E-cadherin distribution in the prechordal plate cells in the control and ethanol treated embryos at 8hpf. White dotted lines indicate prechordal plate cells that were analyzed. (F,G) Co-staining with TO-PRO-3 labeled nuclei in the prechordal plate cells of control and ethanol treated embryos. (H,I) TO-PRO-3 was used as mask to exclude nuclei from E-cadherin intensity measurements. (J,K) E-cadherin distribution in the cytoplasm and cell surface after mask was applied. Arrowheads, cell surface; arrows, cytoplasmic aggregates. (L) Ethanol treatment did not change E-cadherin expression levels. Immunoblot analysis showed E-cadherin expression in the control and ethanol treated embryos at 6, 7 and 8hpf. Arrow indicates an E-cadherin isoform that accumulated, which migrated more slowly. PHENOTYPE:
|
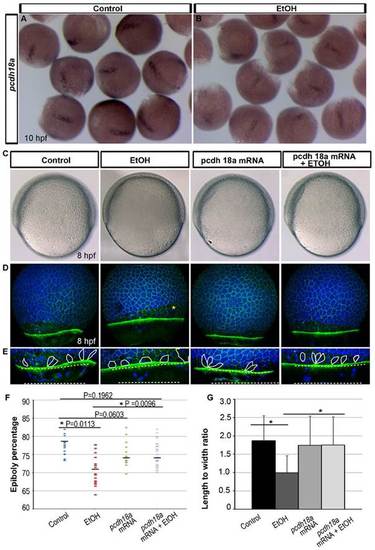
Ethanol induced epiboly defect was rescued by pcdh18a mRNA injection. (A,B) Whole mount in situ hybridization detecting pcdh18a mRNA showed reduced expression in the ethanol treated 10hpf embryos as compared to control. (C) Bright field images focused at the EVL margin showed epiboly progression in the control, ethanol treated, pcdh18a mRNA injected, and pcdh18a mRNA injected plus ethanol treated embryos. (D) 3D renderings of confocal microscopy optical sections of phalloidin stained embryos co-labelled with TO-PRO-3 showed reduced epiboly in the ethanol treated embryos. Epiboly progression was similar in the control, pcdh18a mRNA injected, and pcdh18a mRNA injected plus ethanol treated embryos. Yellow asterisk indicates big multiucleated cells. (E) High magnification images of the embryos highlighting cell boundaries of a few EVL cells. Control, mRNA injected, and mRNA injected plus ethanol treated embryos showed elongated EVL cells; ethanol treated embryos showed rounder EVL cells that were not correctly aligned. Yellow perforated line: EVL margin; white line: yolk syncytial nuclei margin. Note: mRNA injected plus ethanol treated embryos showed more YSL nuclei beyond the EVL as compared to ethanol treated embryo. (F) Scatter plot representation shows reduced epiboly movement in ethanol treated embryos compared to control. These reduced epiboly movements were rescued by pcdh18a mRNA injection. (G) Histogram shows rescue by pcdh18a mRNA injection of the EVL cells length-to-width ratios at the embryo margins, which are reduced after ethanol treatment. Asterisks indicate statistical significance: *P<0.0001. EXPRESSION / LABELING:
PHENOTYPE:
|