
- Title
-
Zebrafish Dynamin is required for maintenance of enveloping layer integrity and the progression of epiboly
- Authors
- Lepage, S.E., Tada, M., and Bruce, A.E.
- Source
- Full text @ Dev. Biol.

Dynasore treatment impairs epiboly of the deep cells and EVL. ((A)(C)) Live images of a representative untreated ((A)(A′′)), DMSO control treated ((B)(B′′)) and dynasore treated embryo ((C)(C′′)) at epiboly initiation ((A)(C)), mid-epiboly ((A2)(C2)) and late epiboly progression ((A′′)(C′′)). Arrowhead in (C) indicates uneven doming of the blastoderm, arrowheads in ((A′)(C2)) indicate the embryonic shield and arrows in ((A′′)(C′′)) mark the approximate position of the advancing blastoderm margin. ((D)(F)) Phalloidin (red) and sytox (green) co-staining showing the effect of dynasore treatment (F) on epiboly of the deep cell margin (DCM), EVL and YSL (marked by the YSN). Arrowheads in (F) show the advanced position of YSN ahead of the blastoderm margin. (G) Quantification of the effect of dynasore treatment on epiboly progression. Bars represent the mean percentage of yolk coverage (n=10). Error bars indicate standard deviation and statistical significance was determined by t-test, *P<0.01. (For interpretation of the references to color in this figure legend, the reader is referred to the web version of this article.) |

Dynamin-dependent fluid-phase endocytosis within the yolk cell is dispensable for epiboly progression. ((A)(D)) Live images of epiboly in a representative uninjected embryo ((A)(A′′)), control injected embryo ((B)(B′′)) and embryos expressing DN-Dnm2 globally ((C)(C′′)) or in a yolk-biased manner ((D)(D′′)). Embryos are shown in lateral view at approximately 30% epiboly ((A)(D)), 60% epiboly ((A2)(D′)) and at bud stage ((A′′)(D′′)). Arrows in ((A′)(D′)) indicate the position of the advancing blastoderm margin. (E) Schematic diagram of global versus yolk-biased injection method. ((F) and (G)) Quantification of the effect of global and yolk-biased DN-Dnm2 expression on epiboly progression. Bars represent the mean percentage of yolk coverage. Error bars indicate standard deviation and statistical significance was determined by t-test, *P<0.01. |
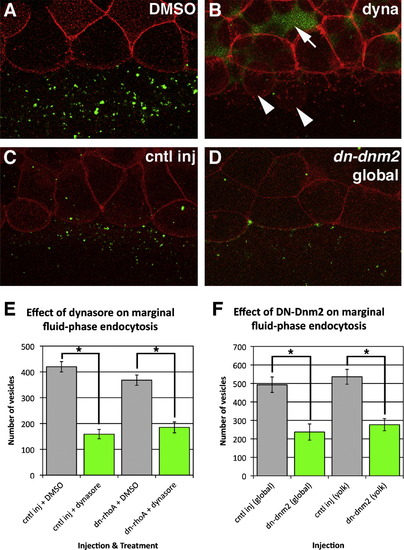
Dynamin-dependence of fluid-phase endocytosis at the blastoderm margin. ((A)(D)) The effect of dynasore treatment ((A) and (B)) and global DN-Dnm2 ((C) and (D)) expression on the uptake of a fluorescent fluid-phase marker, FITC. All embryos are globally expressing mRFP to show the position of the EVL margin. Arrow in (B) shows the passage of our fluid-phase marker into the deep cell layer, while arrowheads indicate cells which have passed the EVL margin. ((E) and (F)) Quantification of vesicle number in embryos treated with dynasore and those expressing DN-Dnm2. Bars represent the least squares mean vesicle number±standard error. Statistical significance was tested using two-way ANOVAs. Dynasore treatment: F3,60=43.90, P<0.0001; Day: F5,60=18.01, P<0.0001. A Tukey HSD test indicated the control differed significantly from dynasore treatment in both control injected and dn-rho RNA injected groups. Global DN-Dnm2: F1,14=16.63, P=0.0011; Day: F2,14=5.57, P=0.0166. Yolk-biased DN-Dnm2: F1,36=27.70, P<0.0001; Day: F4,36=3.05, P=0.029. |
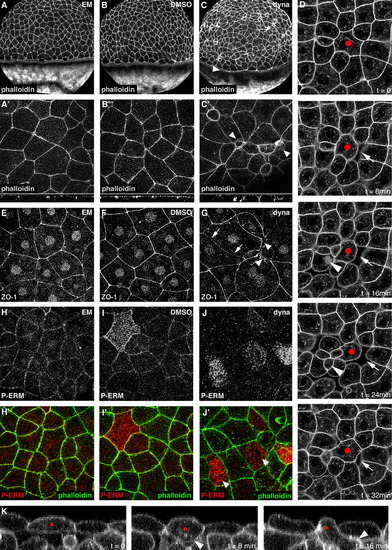
Dynamin is essential for maintaining EVL cell morphology and epithelial integrity. ((A)(C)) Phalloidin staining showing EVL cell morphology and F-Actin organization in untreated ((A) and (A′)), DMSO control treated ((B) and (B′)) and dynasore treated embryos ((C) and (C′)). Low magnification images in ((A)(C)) show actin organization in the EVL and yolk cell. Arrowhead in (C) shows that the actomyosin ring in the E-YSL is intact. Higher magnification projections in ((A′)(C′)) are taken from the animal pole. Representative XZ planes from the Z-stacks in ((A′)(C′)) are shown below each image. Arrowheads in (C′) indicate EVL cells that are protruding below the plane of the EVL. (D) Time-lapse imaging of an embryo expressing mGFP and treated with dynasore. Single planes taken from the sub-apical region of the EVL are shown. The red dot marks a cell tracked over a 32 min period. Arrows mark a transient gap formed between the membranes of adjacent cells and arrowheads show a cell from below the plane of the EVL which is incorporated into the EVL and subsequently basally extruded. These defects were never observed in control time-lapse images. ((E)(G)) Localization of ZO-1 in the EVL of untreated (E), DMSO control treated (F) and dynasore treated (G) embryos. ((H)(J)) Localization of P-ERM in the EVL of untreated ((H) and (H′)), DMSO control treated ((I) and (I′)) and dynasore treated ((J) and (J′)) embryos. Overlay with phalloidin staining is shown in ((H′)(I)). (K) An XZ plane taken from a time-lapse as in (D) showing an EVL cell (red dot) sending a protrusion into the underlying deep cells (arrowhead). Apical to the top. (For interpretation of the references to color in this figure legend, the reader is referred to the web version of this article.) |
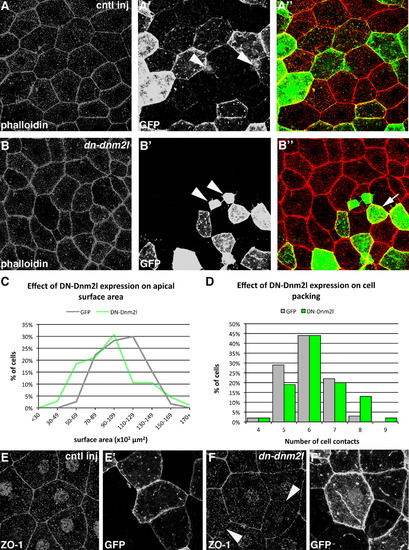
EVL-biased DN-Dnm2 expression disrupts cell morphology, cell packing and ZO-1 localization. ((A) and (B)) EVL cell morphology in embryos mosaically expressing GFP alone (cntl inj, (A)(A′′)) or GFP and DN-Dnm2l ((B)(B′′)). Phalloidin staining is shown in ((A) and (B)), GFP-marked clones in ((A′) and (B′)) and overlay in ((A′′) and (B′′)). Arrowheads in ((A′) and (B′)) show deep cells that have been labeled. Arrow in (B′′) indicates a DN-Dnm2l expressing cell which is abnormally small, lacks its characteristic polygonal shape and contacts a neighbouring cell at a vertex instead of along its edge. ((C) and (D)) Quantification of the effect of DN-Dnm2l on EVL cell apical surface area and cell packing. ((E) and (F)) ZO-1 localization in GFP ((E) and (E′)) and DN-Dnm2l ((F) and (F′)) expressing clones. Arrowheads in (E) indicate regions of reduced and discontinuous ZO-1 antibody staining. |
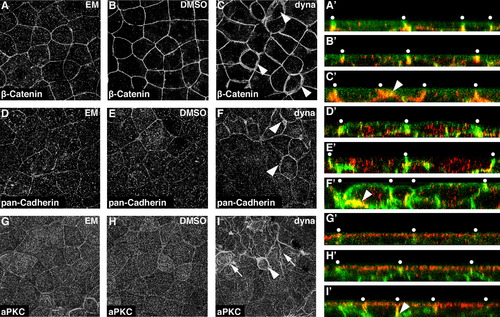
Dynamin inhibition disrupts the organization of the adherens junction. ((A)(I)) Localization of adherens junction components β-Catenin ((A)(C)) and E-Cadheren ((D)(F)), and apical membrane marker aPKC ((G)(I)) in untreated ((A), (D) and (G)), DMSO control treated ((B), (E) and (H)) and dynasore treated ((C), (F) and (I)) embryos. Confocal projections from the animal pole are shown in ((A)(I)). Arrowheads in ((C), (F) and (I)) indicate cells with enriched staining at the junction between cells. Arrows in (I) indicate folds in the apical membrane. Enlarged representative XZ planes showing the localization of each protein with respect to the apicalbasal axis of the EVL are shown in ((A′)(I′)). Membranes are marked with mGFP for reference and apical is to the top. White dots are placed approximately above the intercellular junctions. Arrowheads indicate regions of aberrant antibody staining. |

Dynasore treatment does not cause major defects in EVL specification or apoptosis. ((A)(C)) Expression of keratin 4 (krt4), a marker of EVL differentiation, in untreated (A), DMSO control treated (B) and dynasore treated (C) embryos. Arrowheads in (C) indicate regions with reduced krt4 staining. ((D)(F)) Co-staining of untreated (D), DMSO treated (E) and dynasore treated (F) embryos with phalloidin and anti-cleaved Caspase 3, a marker of apoptotic cell death. Few Caspase 3-positive cells are observed in (F). Inset in (F) shows that these cells are not incorporated in the EVL. |

Dynamin maintains EVL integrity and epiboly through the regulation of Rho A. ((A)(D)) Live images of epiboly in control injected embryos ((A)(C)) and embryos expressing DN-Rho (D) when left untreated (A), treated with DMSO (B) or treated with dynasore ((C) and (D)). ((E)(L)) Phalloidin staining of embryos injected and treated as in ((A)(D)). High magnification images in ((I)(L)) are taken from the animal pole and nuclei are marked by H2A mCherry. Arrowhead in (K) indicates a constricted cell that has an intact nucleus. (M) Quantification of the rescue of dynasore-induced epiboly delay by expression of DN-Rho. Bars represent the percentage of embryos displaying an epiboly delay±standard deviation. Statistical significance was determined by t-test, P<0.0001. |
Reprinted from Developmental Biology, 385(1), Lepage, S.E., Tada, M., and Bruce, A.E., Zebrafish Dynamin is required for maintenance of enveloping layer integrity and the progression of epiboly, 52-66, Copyright (2014) with permission from Elsevier. Full text @ Dev. Biol.