
- Title
-
Functional characterisation of the maturation of the blood-brain barrier in larval zebrafish
- Authors
- Fleming, A., Diekmann, H., and Goldsmith, P.
- Source
- Full text @ PLoS One

Investigation of blood-brain barrier maturation using fluorescent dyes. Ai-iv) One hour after pericardial injection of Evans blue into 8 d.p.f. Tg(fli1a:EGFP)y1 larvae, strong Evan’s blue fluorescence could be observed in the dorsal aorta (arrows) and vena cava (arrowheads) and weak fluorescence could be observed in individual segmental vessels of the trunk. Bi-iv) 4 hours after injection of Evan’s blue, strong fluorescence is still observed in dorsal aorta and vena cava and additionally in segmental vessels. In addition, fluorescence is also observed in trunk muscles between the segmental vessels and in the fin mesenchyme demonstrating that the dye has penetrated into surrounding tissue. Ci) Parasagittal section of a 3 d.p.f. zebrafish larva 3 hours after pericardial injection with saline control. Cii) High magnification fluorescent imaging of the region of marked in Ci). Di) Parasagittal section of a 3 d.p.f. zebrafish larva 3 hours after pericardial injection with Evan’s blue. Dii) High magnification fluorescent imaging of the region of marked in Di). Ei) Parasagittal section of a 5 d.p.f. zebrafish larva 3 hours after pericardial injection with Evan’s Blue. Cii) High magnification fluorescent imaging of the region of marked in Ci). Cii – Eii) The fluorescent intensity of dye within the brain was quantified using image thesholding (pseudo-coloured green) and area over threshold was measured using AnalySis software. F & G) The fluorescence intensity of injected dyes was measured in the brain of zebrafish following peripheral injection at various time points of zebrafish development. Graphs show mean fluorescent intensity (± std dev.) for each treatment. F) Evans blue, (961 Da) a large molecule known to form multimers with serum proteins, is excluded from the brain from day 5. G) Sodium fluorescein (376 Da) permeates into the brain until 8 d.p.f. but is excluded at 10 d.p.f. Scale bar represents 250 μm in A and B and 50 μm in C - E. |

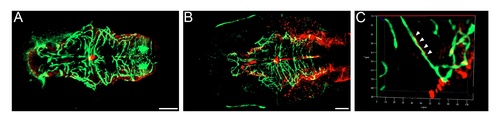
Sequence comparison and expression of zebrafish ABCB1/4/5 homologues. A) Sequence alignment of human and mouse ABCB1 protein sequences with zebrafish Abcb4 and Abcb5. The zebrafish proteins show a high level of identity with the mouse and human ABCB1, ABCB4 and ABCB5 proteins. An antibody recognising the peptide sequences VQAALD (yellow) and VQEALD (blue) (Covance) was selected for use in zebrafish as the similarity of these peptides was conserved. B (low magnification) and C) (high magnification) 3D projections of optically sectioned wholemount Tg(fli1a:EGFP)y1 larvae stained with the anti-VQAALD antibody. Positive staining is observed in the vascular endothelium of the CNS at 8 d.p.f , but not at earlier timepoints (see Figure S2). High magnification images (Ci-iii) demonstrate the co-localisation of ABCB1/4/5 antibody staining (red) on cerebral vessels (green). Bi and Ci – GFP channel – maximum intensity projection of the cerebral vasculature of Tg(fli1a:EGFP)y1 transgenic larvae; Bii and Cii – Alexa 568 labelled antibody staining with ABCB1/4/5 antibody; Biii and Ciii – overlay. EXPRESSION / LABELING:
|

Rhodamine 123 distribution is altered in the presence of verapamil. A) Dye distribution and quantification experiments using rhodamine 123 (R123) were performed as described for Figure 1. Graph shows mean fluorescent intensity (± std dev.) for each treatment. Rhodamine 123 (grey bars), a substrate for mammalian ABCB1, ABCB4 and ABCB5, was excluded from the brain by 8 d.p.f. which, coincides with the onset of zebrafish Abcb/4/5 staining in the vasculature of the CNS. When 8 d.p.f. and 10 d.p.f. larvae were incubated with verapamil (white bars), an inhibitor of ABCB1, ABCB4 and ABCB5 in mammals, R123 failed to be excluded, consistent with blocked Abcb1/4/5 function. B and C) Representative images of parasagittal section of 5 d.p.f. larvae following pericardial injection of saline (B) or Rhodamine 123 (C). Fluorescence in the brain is observed following injection of Rhodamine 123. Scale bar represents 50 μm. |
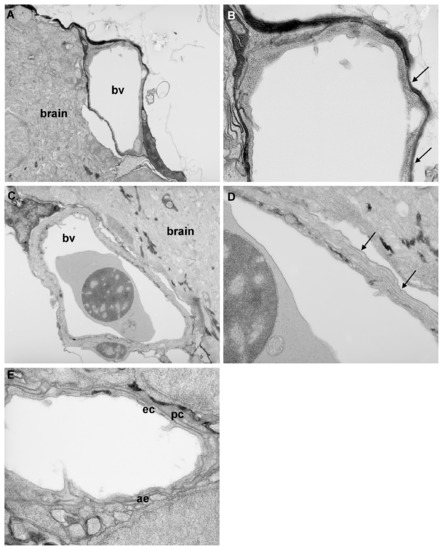
Transmission electron microscopy analysis of blood-brain barrier maturation. Parasaggital sections through the brain of zebrafish larvae at 3 d.p.f. and 10 d.p.f. A) At 3 d.p.f., blood vessels (bv) surrounding the brain are simple in structure. B) At high resolution, only a single membrane is observed (arrows) no evidence of double membranes was observed at any location examined. C) At 10 d.p.f., blood vessels surrounding the CNS are more complex in structure. D) At high resolution, a double layer membrane is apparent (arrows), indicative of the presence of tight junctions. E) In some vessels at 10 d.p.f., pericytes (pc) could be observed surrounding endothelial cells (ec). In addition, astrocyte endfeet (ae) were observed around some vessels at 10 d.p.f. but not at earlier ages. Magnification: A & C 5.2K; B, D & E 15.5K. |
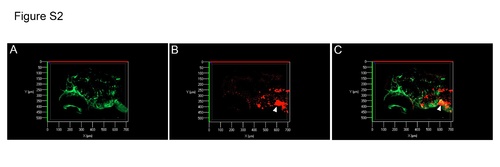
Expression of zebrafish ABCB1/4/5 homologue at 3 d.p.f. Maximum intensity projection of the cerebral vasculature of Tg(fli1a:EGFP)y1 transgenic embryos at 3 d.p.f. A) GFP labels the vasculature; B) Alexa 568 labelled antibody staining with ABCB1/4/5 antibody; C) overlay. ABCB1/4/5 antibody does not co-localise with the vascular endothelium at 3 d.p.f. although positive antibody staining is observed in the liver primordium (arrowhead). EXPRESSION / LABELING:
|
Expression of GFAP around cerebral vessels. Maximum intensity projections of Tg(fli1a:EGFP)y1 transgenic larvae stained with GFAP antibody. A) At 7 d.p.f., GFAP staining is observed in the glia but does not co-localise with GFAP in the vasculature. B (low magnification) and C (high magnification) At 10 d.p.f., GFAP staining is observed in some cerebral vessels (arrowheads). Scale bar represents 50 μm. EXPRESSION / LABELING:
|