
- Title
-
Blood Flow Changes Coincide with Cellular Rearrangements during Blood Vessel Pruning in Zebrafish Embryos
- Authors
- Kochhan, E., Lenard, A., Ellertsdottir, E., Herwig, L., Affolter, M., Belting, H.G., and Siekmann, A.F.
- Source
- Full text @ PLoS One
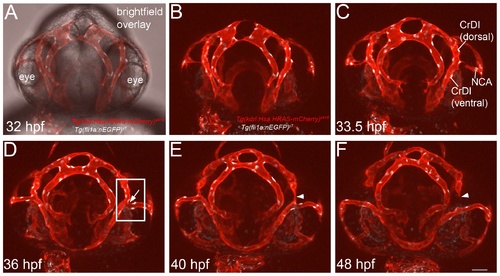
Pruning of the Cranial Division of the Internal Carotid Artery (CrDI) during eye blood vessel development in zebrafish embryos. Relative zebavidin mRNA quantification was performed with qRT-PCR (A) in adult zebrafish tissues and (B) in developing zebrafish (0-7 days post fertilization (dpf)). Expression analysis of each tissue in (A) are shown as the mean (error bar = SD) of the biological replicates. The two-sample t-test was used to compare the expression between female gonads and female gills (P = 0.002), male gonads and male gills (nonsignificant, NS), female gonads and male gonads (P = 0.023) and female gills and male gills (NS). Expression analysis of the developmental samples in (B) are shown as the mean (SD) of the biological replicates on 0 dpf and as the mean (SD) of the technical replicates on 1-7 dpf. All of the developmental samples were pooled from 15 to 50 individuals depending on the age of embryos. The two-sample t-test was used to compare the expression of 0 dpf and 1 dpf samples to later time points. A statistically significant difference in expression was found between the 0 dpf sample and all of the other samples (P < 0.0001 in all comparisons) and also between the 1 dpf sample and the samples of 2, 4, 5, 6 and 7 dpf (P < 0.05 in all comparisons). In both (A) and (B) the expression of zebavidin is normalized to EF1a expression. The insets in the upper right corners represent enlargements of parts of the actual figures. (C) Embryos, injected with a Morpholino blocking the translation initiation site or with a random control Morpholino, 24 h after injection in comparison with WT embryos. (D) Embryos 48 h after injection. |
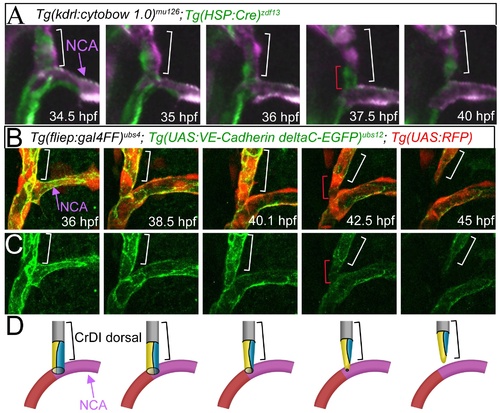
Endothelial cells rearrange from a multicellular into a partially unicellular tube during blood vessel pruning. (A) Still images from a time-lapse movie of Tg(kdrl:cytobow1.0)mu125; Tg(HSP:Cre)zdf13 embryos. Imaged area indicated with box in Figure 1D. Bracket marks dorsal CrDI. At the 37.5 hpf time point, note unicellular connection between the dorsal CrDI and the NCA (single green cell, marked with red bracket). (B) Merged still images from time-lapse imaging of Tg(UAS:RFP); Tg(fliep:Gal4FF)ubs4; Tg(UAS:VE-cadherin-deltaC-EGFP)ubs12 between 36 and 45 hpf. Red bracket at 42.5 hpf indicates unicellular connection between dorsal CrDI and NCA. (C) Still images from Tg(UAS:VE-cadherin-deltaC-EGFP)ubs12 expression corresponding to images in B. (D) Schematic drawing of cell rearrangements shown in B, C. Brackets label dorsal CrDI, purple arrow highlights NCA. |

Endothelial cell apoptosis during CrDI pruning. All images in lateral view with anterior to the left. (A) Stills of time-lapse imaging of Tg(kdrl:H2B-EGFP)mu122, Tg(kdrl:Hsa.HRAS-mCherry)s916 from 37-45 hpf. (A′) Tg(kdrl:H2B-EGFP)mu122 channel only. White brackets indicate dorsal CrDI. Yellow arrow in (A) and (A′) at 42.25 hpf time point points to dying cell. (B) Stills of time- lapse imaging of Tg(kdrl:H2B-EGFP)mu122; Tg(kdrl:Hsa.HRAS-mCherry)s916 embryos from 36-48 hpf injected with bcl2 RNA. No dying cells are detectable in the CrDI. (B′) Tg(kdrl:H2B-EGFP)mu122 channel only. (C) Brightfield images of bcl2 mRNA or uninjected embryos. (D) Acridine orange staining on bcl2 mRNA injected or control embryos. (E) Quantification of CrDI pruning at 48 hpf. |
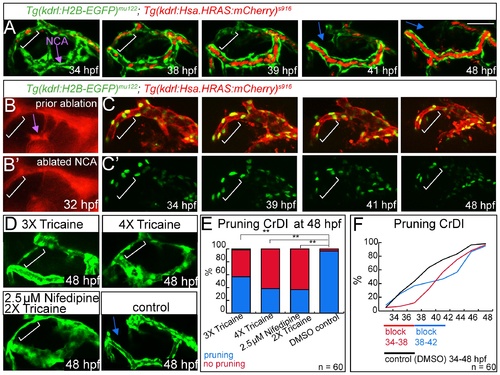
Pruning of the CrDI is flow dependent. Lateral views, anterior to the left, dorsal to the top. (A) Still images of time-lapse of Tg(kdrl:EGFP)s843; Tg(gata1a:DsRed)sd2 from 34–48 hpf. White brackets indicate dorsal CrDI, purple arrow indicates NCA. Note reduction of blood flow in dorsal CrDI (39 hpf time point) prior to regression (blue arrows at 41 and 48 hpf time points). (B) Laser ablation of NCA at 32 hpf (purple arrow), compare to (B′). (C) Time-lapse imaging from 34–48 hpf of Tg(kdrl:H2B-EGFP)mu122; Tg(kdrl:Hsa.HRAS-mCherry)s916 after NCA ablation and Tg(kdrl:H2B-EGFP)mu122 only (C′). Note persistent CrDI (white brackets). (D) Blocking of heartbeat by indicated drug treatments from 30–48 hpf and imaging at 48 hpf. (E) Quantification of drug treatments shown in D. (F) Influence of 4 hr block of heartbeat followed by drug wash out on CrDI regression at indicated time points. Scale bar = 50 μm. |