
- Title
-
Pou5f1 protein expression and posttranslational modification during early zebrafish development
- Authors
- Lippok, B., Song, S., and Driever, W.
- Source
- Full text @ Dev. Dyn.
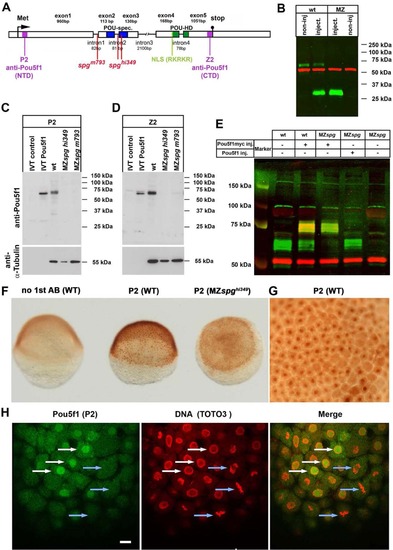
Expression of Pou5f1 specific protein during early zebrafish embryo development. A: Schematic representation showing translation start (arrow) and stop codon, location of POU-specific (blue) and POU homeo-domains (green), and a putative nuclear localization site (NLS) based on sequence comparison to the mammalian Oct4 NLS (Pan et al., 2004) is also indicated (light green). Sequence used to produce Pou5f1 specific P2 and Z2 (purple) antibodies. Positions of the point mutation in spgm793 (Belting et al., 2011) and the insertion site in spghi349 mutants (Burgess et al., 2002) are indicated. B: Fluorescent Western blot analysis using Pou5f1 (P2, green) and α-tubulin (red) antibodies with extracts of 70% epiboly stage wild-type (WT) and MZspg whole embryo extracts. Embryos for samples labeled “inject” were injected with mRNA encoding the truncated spgm793 mutant form of Pou5f1. Endogenous Pou5f1 protein (green) was detected only in WT around 60 kDa. The overexpressed mutant truncated form of Pou5f1 was detected around 30 kDa only in mRNA injected embryos, but not in noninjected MZspg embryos, indicating that no detectable amounts of the truncated form accumulate in MZspg embryos. C,D: Western blot analysis using anti-Pou5f1 P2 (C) or Z2 (D) antibodies shows in vitro translated Pou5f1 as a single protein band at around 60 kDa, while in WT embryo extracts multiple bands are detected within a close molecular mass range similar to the in vitro transcribed protein. Pou5f1 signal was detected neither in MZspgm793 nor in MZspghi349 mutant embryos. anti-α-tubulin was used as loading control after stripping and re-blocking. E: Fluorescent Western blot analysis of extracts from WT and MZspg whole embryo extracts at 7 hpf. Anti-Pou5f1 P2 antibody shows Pou5f1 (green), anti-Myc shows Myc-tagged Pou5f1 (red), and anti α-tubulin the loading control (red). The protein band of Myc-tagged Pou5f1 was shifted to 75 kDa due to the Myc-tag, compared with un-tagged Pou5f1 (60 kDa). α-tubulin served as loading control (red, 55 kDa). F: Control for specificity of P2 Pou5f1 antibody in shield stage whole-mount embryos stained by DAB immunohistochemistry. Left embryo is WT control treated with anti-rabbit secondary antibodies only. Center WT embryo was stained with P2 plus secondary antibodies. Right embryo is a MZspghi349 mutant stained with P2 plus secondary antibodies. G: Higher magnification view of animal pole of sphere stage WT embryo revealing nuclear localization of signal in most cells. H: Confocal images of WT whole-mount embryos at sphere stage stained for anti-Pou5f1 (P2, green) and Toto3 (red) to visualize all nuclei. Blastomeres are shown which differ in cell cycle phases. White arrows indicate potential interphase nuclei and light blue arrows indicate blastomeres in mitosis. During mitosis chromatin is condensed, the nuclear envelope is not present, and Pou5f1 appears to redistribute to the cytoplasm. Animal views. Scale bar = 20 µm. EXPRESSION / LABELING:
|
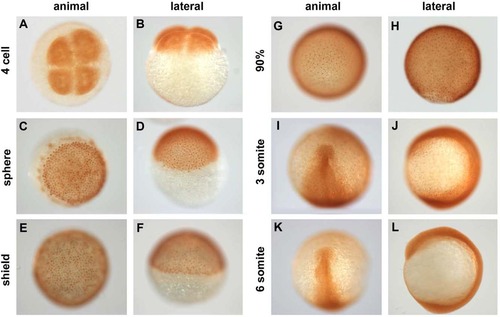
Spatiotemporal distribution of Pou5f1 in wild-type (WT) embryos. A–L: Pou5f1 distribution in whole-mount WT embryos from four-cell to six-somite stages analyzed by anti Pou5f1 HRP/DAB immunohistochemistry. Animal views (A,C,E,G,I,K), dorsal to the bottom (E,G,I,K), and lateral views (B,D,F,H,J,L), dorsal to the right (F,H,J,L). EXPRESSION / LABELING:
|

Pou5f1 in dorsal ectoderm cell nuclei in wild-type (WT) embryos at one-somite stage. A–C: Confocal images of anti-Pou5f1 immunofluorescence (green) WT whole-mount embryos at one-somite stage in which all cell nuclei were stained with TOTO-3 (red). A′–C′: Higher magnification of rectangle area in A is shown. Arrows indicate region from which on reduced Pou5f1 levels are detected in the caudal neural plate. Dorsal views, animal pole to the top. EXPRESSION / LABELING:
|

Distribution of Pou5f1 in enveloping layer (EVL), deep cells and yolk syncytial layer (YSL) of wild-type (WT) embryos. A–I: Confocal images of anti-Pou5f1 immunofluorescence (green) WT whole-mount embryos at 90% epiboly (A–C) and sphere (D–I) stages in which all cell nuclei were stained with Toto3 (red). Blue arrows indicate blastoderm cell nuclei and white arrows indicate yolk syncytial nuclei. Large nuclei in A–C are EVL nuclei. Pou5f1 was not localized to chromatin in dividing blastomeres (blue arrows with asterisk), and also not in yolk syncytial nuclei (white arrows). Blastoderm layer at the animal pole (A–C), lateral margin (D–F), and frontal margin (G–I) are shown. EXPRESSION / LABELING:
|
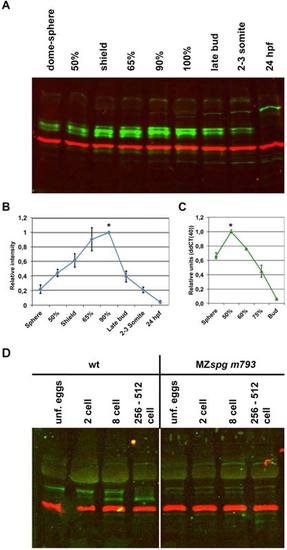
Temporal Pou5f1 profile during early embryo development. A: Pou5f1 protein amounts (green, around 60 kDa) from 4 hr postfertilization (hpf) to 24 hpf wild-type (WT) whole embryo extracts analyzed by fluorescent Western blot analysis. α-tubulin is shown as loading control (red, 55 kDa). In the Western blot, an additional faint higher molecular weight band is detected at approximately 150 kDa from mid-gastrula on, and a second band appears from the end of gastrulation at approximately 100 kDa. These bands are also present in MZspg embryos, and thus do not correspond to Pou5f1 forms but are nonspecific bands. B: Relative quantification of Pou5f1 immunoreactive band intensity from 4 to 24 hpf indicates that Pou5f1 protein amount is highest between 6 hpf (65% epiboly stage) and 10 hpf (100% epiboly stage). Pou5f1 band intensity values were normalized using the α-tubulin band intensity values. The Pou5f1 protein signal in WT at 90% epiboly stage was set to 100%. C: Relative quantification of pou5f1 mRNA message from 4 hpf (sphere) to 10 hpf (bud) by quantitative reverse transcriptase-polymerase chain reaction (RT-PCR). pou5f1 mRNA amount is highest at 50% epiboly stage and decays afterward. Elongation factor alpha (eef1a1a) was used as a normalization control. pou5f1 mRNA signal in WT at 50% epiboly stage was set to 100%. D: Pou5f1 at pre-MBT stages. Pou5f1 protein is already present in unfertilized eggs, but the band is shifted to higher molecular mass compared with a new Pou5f1 band that appears faintly at two-cell stage and then prominently from eight-cell stage on. The right part shows absence of Pou5f1 bands from MZspg mutant embryos. Fluorescent Western blot analysis using P2 Pou5f1 antibody (green) and anti-α-tubulin as loading control (red, 55 kDa). |

Pou5f1 modification by phosphorylation. Western blot analysis of 70% epiboly stage embryo extracts treated at 37°C with phosphatase inhibitor (PI) or alkaline phosphatase (AP) for defined periods (indicated at bottom). Pou5f1-positive protein bands were detected around 60 kDa in wild-type (WT) but reduced to a band of approximately 57 kDa molecular mass upon AP treatment. Anti-α-tubulin was used as loading control (red, 55 kDa). EXPRESSION / LABELING:
|