
- Title
-
Stimulation of mTORC1 with L-leucine Rescues Defects Associated with Roberts Syndrome
- Authors
- Xu, B., Lee, K.K., Zhang, L., and Gerton, J.L.
- Source
- Full text @ PLoS Genet.
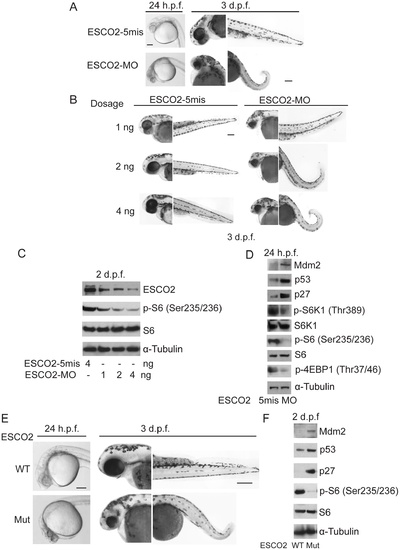
Reduced ESCO2 function is associated with mTOR inhibition, p53 activation, and dramatic developmental phenotypes in zebrafish. Total levels of S6, S6K1, and tubulin serve as loading controls. (A). Embryos were microinjected with 4 ng ESCO2-5mismatched morpholino (ESCO2-5mis) or ESCO2-ATG morpholino (ESCO2-MO) and photographed at 24 hours post fertilization (h.p.f.) and 3 days post fertilization (d.p.f.). Scale bar = 200 µm. (B). Embryos were microinjected with 1, 2, or 4 ng ESCO2-5mis or ESCO2-MO and photographed at 3 d.p.f. Scale bar = 200 μm. (C). Embryos were microinjected with 4 ng ESCO2-5mis or 1, 2, or 4 ng ESCO2-MO to test the effect of dosage on phophorylation of S6 by Western blot at 2 d.p.f. (D). ESCO2 morphant embryos (2 ng) show inhibition of the TOR pathway and accompanying activation of p53 at 24 h.p.f.. (E). ESCO2-transgenic mutant zebrafish embryos show gross developmental abnormalities compared with WT embryos at 24 h.p.f. and 3 d.p.f.. Bar = 200 μm. (F). ESCO2 mutant embryos show reduced S6 phosphorylation and upregulation of p53, Mdm2, and p27 by Western blot analysis. PHENOTYPE:
|

L-leucine partially improved developmental deficiencies of ESCO2 depleted embryos in a TOR pathway-dependent manner. (A). Embryos (1–2 cells) were injected with ESCO2-5mis or ESCO2-MO (4 ng) and immediately separated for D-Leu or L-Leu incubation (10 mM) for 2 d.p.f. L-Leu supplement partially rescued development of ESCO2-morphant embryos at a gross level. Scale bar = 200 μm. Animals were categorized as mildly affected, severely affected, or dead to further quantify the rescue. (B). The number of severely malformed and lethal embryos was quantified for ESCO2-depleted embryos in the presence of D-Leu or L-Leu supplement at 4 days post fertilization. A total of 73-115 embryos were quantified per condition (ESCO2-5mis with D-Leu (n = 73), ESCO2-MO with D-Leu (n = 114), ESCO2-5mis with L-Leu (n = 97), and ESCO2-MO with L-Leu (n = 115)). (C). Embryos (1–2 cells) were injected with ESCO2-MO (4 ng) and immediately transferred to L-Leu incubation at different concentrations. L-Leu supplement ameliorated the developmental defects of ESCO2 morphant embryos in a dosage-dependent manner. While the image is representative, about 20 embryos were analyzed per group. Bar = 200 µm. (D). Embryos (1–2 cells) were injected with ESCO2-5mis or ESCO2-MO (4 ng) and immediately separated into D-Leu or L-Leu incubation (3 mM) for 24 h.p.f.. By Western blot analysis, L-Leu supplement partially rescued phosphorylation of S6 in the ESCO2-MO embryos. S6 and tubulin serve as loading controls. Each sample contains ~100 embryos. (E). Embryos (1–2 cells) were injected with ESCO2-5mis or ESCO2-MO (4 ng), and immediately separated into D-Leu or L-Leu incubation (10 mM) for 3 d.p.f., in the presence or absence of 200 nM rapamycin. While the image is representative, about 15 embryos were analyzed per group. Rapamycin curtails L-Leu rescue of ESCO2-morphants, and enhances malformation of ESCO2-depleted embryos. Bar = 200 μm. (F). WT and ESCO2 mutant embryos (1–2 cells) were incubated with 10 mM D-Leu or L-Leu for 4 d.p.f., and photographed. L-Leu treatment partially rescued development of ESCO2 mutant embryos. While the image is representative, about 10 embryos were analyzed per group. Bar = 200 μm. (G). WT and ESCO2 mutant embryos (1–2 cells) were incubated with 10 mM D-Leu or L-Leu for 2 d.p.f. Western blotting shows L-Leu treatment partially restored phosphorylation of S6 in ESCO2 mutant embryos, but p53 elevation persists. S6 and tubulin serve as loading controls. |

L-leucine rescues many aspects of development in ESCO2-depleted embryos. (A). Embryos (1–2 cells) were injected with ESCO2-5mis or ESCO2-MO (4 ng), and immediately separated into D-Leu or L-Leu incubation (10 mM). After 5 d.p.f., the embryos were stained with Alcian blue to detect cartilage development. Scale bar = 200 μm. While the image is representative, about 15 embryos were analyzed per group. (B). WT or ESCO2 mutant embryos were treated with D-Leu or L-Leu (10 mM). After 5 d.p.f., the embryos were stained with Alcian blue to detect cartilage development. While the image is representative, about 10 embryos were analyzed per group. L-leucine partially rescued head size and cartilage formation in (A) and (B). (C). Cranial development was quantified for the data in (A) using the sum of the pq (palatoquadrate) cartilage and mc (Meckel′s cartilage) divided by cranial length, as indicated with lines in (B). The measurement was done on 3 embryos per group. P<0.01, ESCO2-MO with D-Leu treatment vs ESCO2-5mis with D-Leu treatment; P<0.05, ESCO2-MO with L-Leu treatment vs ESCO2-MO with D-Leu treatment. (D). Embryos (1–2 cells) were injected with ESCO2-5mis or ESCO2-MO (2 ng), and immediately separated for D-Leu or L-Leu incubation (10 mM). After 2 d.p.f., the embryos were stained with acridine orange to detect apoptotic cells. Scale bar = 200 μm. (E). The number of apoptotic cells was quantified. P<0.0001, ESCO2-MO with D-Leu treatment vs ESCO2-5mis with D-Leu treatment; P = 0.0006, ESCO2-MO with L-Leu treatment vs ESCO2-MO with D-Leu treatment. (F). Embryos (1–2 cells) were treated as in (A). After 2 d.p.f., single cell suspensions of 10 embryos were generated in triplicate by mashing and filtering in PBS/10% NCS through cell strainers (100 μm, BD Falcon). Cells were resuspended in PBS/10% NCS and suspensions used in Caspase-Glo 3/7 Assays (Promega) according to the manufacturer′s instructions. Luminescence was measured after 75 minutes on a multi-detection microplate reader. L-Leu treatment suppressed caspase 3/7 activation in the ESCO2-MO embryos. P<0.0001, ESCO2-5mis with D-Leu vs ESCO2-MO with D-Leu; P<0.0001, ESCO2-MO with L-Leu vs ESCO2-MO with D-Leu. (G). Embryos (1–2 cells) were treated as in (A). Embryo length was measured every day up to 4 d.p.f. with a mini-ruler under a Leica Stereoscope for ESCO2-MO and 5-mismatched controls. L-Leu treated ESCO2 morphants had a significantly longer body length compared with ESCO2 morphants treated with D-Leu (P<0.0001, 2-way ANOVA). The measurements were performed from head to tail for 10 embryos per group. |

ESCO2 depletion in zebrafish is associated with an increase in phospho-H3 staining, and L-leucine partially rescues the increase. (A). Embryos (1–2 cells) were injected with ESCO2-5mis or ESCO2-MO (4 ng), and immediately separated for D-Leu or L-Leu incubation (10 mM). At 24 h.p.f., cells were immunostained with anti-phospho-Histone H3 (pH3) antibody to detect mitotic cells. Scale bar = 200 μm. (B). The number of cells in mitosis was quantified for 5 embryos per group. P<0.0001, ESCO2-MO with D-Leu treatment vs ESCO2-5mis with D-Leu treatment; P<0.0001, ESCO2-MO with D-Leu treatment vs ESCO2-MO with L-Leu treatment. (C). A working model for the pathways involved in RBS is presented. Due to mutation in ESCO2, significant intracellular stress occurs due to defects in DNA replication, repair, and rDNA processes. This stress is detected by AMPK which can signal the activation of p53 [116] and the phosphorylation of TSC2. The phosphorylation of TSC2 will act to inhibit mTORC1 and downstream effectors such as 4EBP1, S6, and S6 kinase with the ultimate effect being the inhibition of translation. With the addition of L-leucine (green arrows), the leucyl tRNA synthetase will collaborate with the Rag GTPase to activate mTORC1, partially rescuing translation. |

The rescue of RBS zebrafish depends on ESCO2 mRNA, L-leucine and L-glutamine. (A, B). The specificity of the phenotype in ESCO2-morphant and mutant embryos was tested by injection of in vitro transcribed RNA encoding ESCO2 protein. Control injections were performed with in vitro transcribed control RNA. Scale bar = 200 μm. (C). Embryos (1–2 cells) were injected with ESCO2-5mis or ESCO2-Splice MO with control-mRNA or ESCO2-mRNA co-injection and treated with 200 nM rapamycin. After 2 d.p.f., the ESCO2-splice MO embryos looked more defective than those in which the ESCO2 mRNA was co-injected. (D). Embryos (1–2 cells) were injected with ESCO2-5mis or ESCO2-Splice MO (10 ng), and co-injected with a control mRNA or ESCO2 mRNA. After 5 d.p.f., the embryos were stained with Alcian blue to detect cartilage development. Scale bar = 200 μm. While the image is representative, about 15 embryos were analyzed per group. (E). Cranial development was quantified using the sum of the pq (palatoquadrate) cartilage and mc (Meckel′s cartilage) divided by cranial length. The measurement was done on 3 embryos per group. P<0.001, ESCO2-MO with Control-mRNA co-injection vs ESCO2-5mis with Control-mRNA co-injection; P<0.001, ESCO2-MO with ESCO2-mRNA co-injection vs ESCO2-MO with Control-mRNA co-injection. (F). Embryos (1–2 cells) were injected with ESCO2-5mis or ESCO2-Splice MO (10 ng), and immediately separated into egg water with L-Glutamine (L-Glu) alone (4 mM), L-Leu alone (10 mM), or L-Leu (10 mM) plus L-Glu (4 mM) treatment. After 3 d.p.f., optimal rescue was observed with L-Leu plus L-Glu. Scale bar = 200 μm. (G). Embryos (1–2 cells) were injected with ESCO2-5mis or ESCO2-Splice MO (10 ng), and immediately separated into egg water with D-His (10 mM), D-Leu (10 mM), L-Thr (10 mM) or L-Leu (10 mM) treatment. All treatments included L-Glu (4 mM). After 3 d.p.f., only embryos treated with L-Leu showed partial improvement of development. Scale bar = 200 μm. |
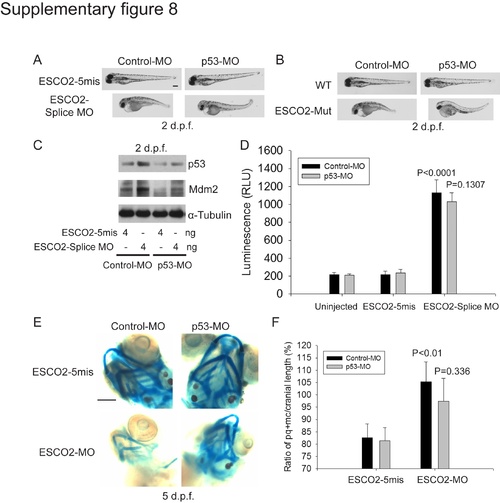
The effects of p53 knockdown on a zebrafish RBS model. (A). Embryos (1–2 cells) were co-injected with ESCO2-5mis or ESCO2-Splice MO (10 ng), and a control morpholino (Control-MO) from Gene Tools or p53 morpholino (p53-MO). After 2 d.p.f., the embryos were photographed. p53 knockdown showed some rescue of development in ESCO2 morphant embryos. Bar = 200 μm. (B). WT or ESCO2 mutant embryos were injected with Control-MO or p53-MO. After 2 d.p.f., the embryos were photographed. p53 knockdown showed some rescue of development in ESCO2 mutant embryos. (C). Embryos (1–2 cells) were co-injected with ESCO2-5mis or ESCO2-Splice MO (10 ng), and Control-MO or p53-MO. After 2 d.p.f. the embryos were harvested and analyzed by Western blot. p53-MO injection reduced p53 levels relative to the control MO in both the ESCO2-5mis and splice MO. Tubulin serves as a loading control. (D). Embryos were treated as in (C). Caspase 3/7 activity was measured as in Figure 7. p53 knockdown did not affect caspase activity in the ESCO2-splice MO. P<0.0001, ESCO2-Splice MO+Control MO vs Uninjected+Control MO or ESCO2-5mis+Control MO; P = 0.1307, ESCO2-Splice MO+p53 MO vs ESCO2-Splice MO+Control MO. (E and F). Embryos (1–2 cells) were co-injected with ESCO2-5mis or ESCO2-Splice MO (10 ng), and a control morpholino (Control-MO) from Gene Tools or p53 morpholino (p53-MO). After 5 d.p.f., the embryos were stained with alcian blue and the craniofacial length was quantified as in Figure 7. P<0.01, ESCO2-5mis+Control-MO vs ESCO2-MO+Control-MO; P = 0.336, ESCO2-MO+Control-MO vs ESCO2-MO+p53-MO. |

p53 inhibition rescues high levels of phospho-histone H3 staining in ESCO2 morphants. (A). Embryos (1–2 cells) were co-injected with ESCO2-5mis or ESCO2-Splice MO (10 ng), and a control morpholino (Control-MO) from Gene Tools or p53 morpholino (p53-MO). At 24 h.p.f., the embryos were dechorionated and immunostained with anti-phospho-Histone H3 antibody to detect mitotic cells in G2/M stage. (B). The number of phospho-histone H3 positive cells was quantified for 5 embryos per group. P<0.0001, ESCO2-5mis+Control-MO vs ESCO2-MO+Control-MO; P<0.0001, ESCO2-MO+Control-MO vs ESCO2-MO+p53-MO. |