
- Title
-
Daam1a mediates asymmetric habenular morphogenesis by regulating dendritic and axonal outgrowth
- Authors
- Colombo, A., Palma, K., Armijo, L., Mione, M., Signore, I.A., Morales, C., Guerrero, N., Meynard, M.M., Pérez, R., Suazo, J., Marcelain, K., Briones, L., Härtel, S., Wilson, S.W., and Concha, M.L.
- Source
- Full text @ Development

Identification of daam1a as a novel gene with asymmetric expression in the zebrafish brain. (A) Strategy for the identification of sequences differentially expressed in left and right sides of the juvenile zebrafish brain. For details, see text. (B) Radioautography images obtained after library hybridisation with probes obtained from direct (top) and reverse (bottom) SSH. Arrows indicate examples of selected clones hybridised by a single SSH condition (red), or showing differential hybridisation intensity between both conditions (blue). (C) Quantitative assessment of kctd12.1 (control asymmetric gene enriched on the left side), cpd2 (control symmetric gene) and daam1a mRNA expression in left (grey) and right (red) halves of juvenile brains. Asterisks indicate statistically significant differences between left and right brain (n=10), after Mann-Whitney test: kctd12.1 (P<0.004); daam1a (P<0.025). Error bars represent standard errors. (D-H) Expression of daam1a mRNA after whole-mount in situ hybridisation in embryonic (D-F), larval (G) and juvenile (H) zebrafish. (I-L) Expression of Daam1a protein visualised by confocal microscopy after whole-mount indirect immunofluorescence (green) in embryonic (I-K) and larval (L) zebrafish. TO-PRO-3 was used as nuclear counterstain (purple). Images in D-L are dorsal views, with anterior to the top. (M,N) Maximum intensity confocal projections showing a single habenular neuron labelled through focal electroporation of pCS2-GAP43-mCherry (red) and immunostained against Daam1a (green). The arrow in M indicates the neuronal soma. The punctate distribution of Daam1a in dendrites is shown by arrowheads in panel N, which corresponds to a magnification view of the boxed region in M. L, left; LHb, left Hb; R, right; RHb, right Hb. Scale bars: 20 μm (D-L); 4 μm (M,N). EXPRESSION / LABELING:
|

Global knockdown of Daam1a affects the formation of habenular neuropil and axonal efferent connectivity to the IPN. (A-O) Dorsal views of the habenular region (A-J) and IPN (K-O) of Tg(pou4f1-hsp70l:GFP) zebrafish at 4.5 dpf, with anterior to the top. The habenular neuropil was immunostained against acetylated α-tubulin (A-E, white), whereas the soma (F-J) and efferent projections (K-O) of dorsal habenular neurons expressing pou4f1-hsp70l:GFP were labelled in vivo (green). Defects in the Hb and IPN induced by injection of daam1a-MO were classified as ‘normal’, ‘mild’, ‘moderate’ or ‘severe’ phenotypes (columns 1-4). Column 5 (rescue) corresponds to the phenotypes observed after co-expression of daam1a-MO and hDAAM1 mRNA. All images are maximum intensity z-stack confocal projections. Vertical dotted brackets in A-E indicate the extent of habenular neuropil in the left Hb. Asterisks in F-J indicate the enlarged cellular domain of the Hb expressing pou4f1-hsp70l:GFP. (P,Q) Distribution of the different phenotypes of habenular neuropil (P) and efferent connectivity to the IPN (Q) in Co-MO, daam1a-MO and rescue conditions. Data are presented as the percentage of total larvae showing the indicated phenotype. L, left; LHb, left Hb; R, right; RHb, right Hb. Scale bars: 20 μm. |
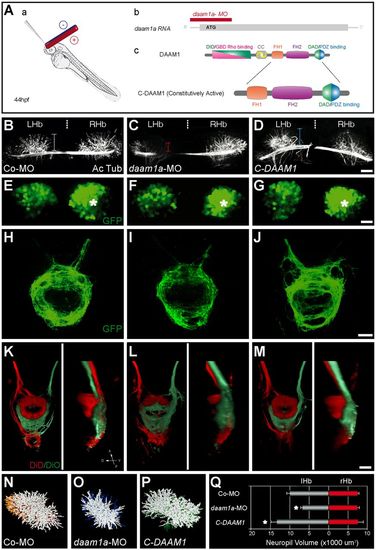
Local loss and gain of Daam1a function induces opposite modulatory effects in the growth of habenular neuropil and axonal efferent connectivity to the IPN. (A) Schematics of the local electroporation procedure (a), daam1a-MO design (b) and constitutively active form of C-Daam1a (c). (B-J) Dorsal views of the habenular region (B-G) and IPN (H-J) of Tg(pou4f1-hsp70l:GFP) zebrafish at 4.5 dpf, with anterior to the top. The habenular neuropil was immunostained against acetylated α-tubulin (B-D, white), whereas the soma (E-G) and efferent projections (H-J) of dorsal habenular neurons expressing pou4f1-hsp70l:GFP were labelled in vivo (green). Vertical dotted brackets in B-D indicate the extent of neuropil development in the left Hb. Asterisks in E-G indicate the enlarged cellular domain of the Hb expressing pou4f1-hsp70l:GFP. (K-M) Dorsal (left) and lateral (right) views of the IPN at 4.5 dpf, with anterior to the top, after labelling the left (red) and right (green) Hb with DiD and DiO, respectively. Images in B-M are maximum intensity z-stack confocal projections, organised in three columns that correspond to different electroporation conditions: control-MO (left), daam1a-MO (middle) and pcDNA-C-DAAM1-HA (right). (N-P) Dorsal views of three-dimensional volumetric reconstructions of the left habenular neuropil in the three electroporation conditions. (Q) Quantification of left (grey) and right (red) habenular neuropil volumes. Asterisks indicate statistically significant decrease (daam1a-MO, n=5) or increase (pcDNA-C-DAAM1-HA, n=5) of left habenular neuropil volume with respect to controls (Co-MO, n=5; control plasmid, n=6), after Mann-Whitney test (P<0.05). Error bars represent s.d. D, dorsal; L, left; LHb, left Hb; R, right; RHb, right Hb; V, ventral. Scale bars: 20 μm. |

Loss and gain of Daam1a function modulates dendritic growth and axonal terminal arborisation of dorsal habenular neurons. (A,E) Single habenular neuron from a control embryo showing the characteristic dense dendritic arborisation (A, arrowheads) and a single unbranched axon (A, arrow) that terminates in the IPN with complex bilateral spiral branches (E). (B,F) Single habenular neuron from a daam1a-MO embryo showing a pruned dendritic arbour (B, arrowheads) and a single axon (B, arrow) with incomplete and less complex organisation of axonal terminals in the IPN (F). (C,G) Single habenular neuron from an embryo co-injected with daam1a-MO and hDAAM1, showing normal dendritic arborisation (C, arrowheads) and partial rescue of axonal terminal morphology in the IPN (G). (D,H) Single habenular neuron from an embryo locally electroporated with pcDNA-C-DAAM1-HA at 44 hpf, showing increased dendritic arborisation (D, arrowheads) and axonal extension in the IPN (H). Images correspond to dorsal views of maximum intensity z-stack confocal projections of single neurons at 4.5 dpf, labelled through focal electroporation of pCS2:GAP43-GFP, with anterior to the top. Scale bars: 10 μm. PHENOTYPE:
|

Knockdown of Daam1a affects the organisation of filamentous actin and microtubules in the Hb. (A,D,G) The Hb of control embryos labelled with fluorescent phalloidin (F-actin, white) and counterstained with Nissl (to delineate the cellular context, purple) show a distinct smooth fibrillar organisation of F-actin, with increased compaction in the neuropil domains. (B,E,H) The Hb of daam1a-MO embryos show an irregular pattern of F-actin, with shorter and thicker bundles. (C,F,I) The Hb of embryos co-injected with daam1a-MO and hDAAM1, show a smooth fibrillar pattern of F-actin similar to controls. (J,M,P) The Hb of control embryos immunostained against α-tubulin (white) and counterstained with Nissl showed a distinct asymmetric distribution of α-tubulin corresponding to the neuropil domains. (K,N,Q) The Hb of daam1a-MO embryos show decreased and less elaborate α-tubulin staining. (L,O,R) The Hb of embryos co-injected with daam1a-MO and hDAAM1, show increased levels and thickness of α-tubulin (+) bundles than controls. G-I and P-R correspond to magnification views of the boxed regions in D-F and M-O, respectively. Images correspond to dorsal views of maximum intensity z-stack confocal projections, with anterior to the top. LHb, left Hb; RHb, right Hb. Scale bars: 20 μm. PHENOTYPE:
|

Daam1a cooperates with Ulk2 in habenular neuropil formation. (A-I) The organisation of habenular neuropil at 4.5 hpf as revealed by anti acetylated α-tubulin immunostaining, after injection at the one- to four-cell stage with Co-MO (A), optimal doses of either ulk2spl-MO (B, 2 ng) or daam1a-MO (C, 8 ng), suboptimal doses of either ulk2spl-MO (D, 1 ng) or daam1a-MO (E, 4 ng), a combination of suboptimal doses of ulk2spl-MO and daam1a-MO (F), optimal doses of ulk2spl-MO (2 ng) combined with either dUlk2 (G) or hDAAM1 (H) mRNAs, or optimal dose of daam1a-MO (8 ng) combined with ulk2 mRNA (I). Images correspond to dorsal views of maximum intensity confocal z-stack projections, with anterior to the top. LHb, left Hb; RHb, right Hb. Scale bar: 20 μm. PHENOTYPE:
|
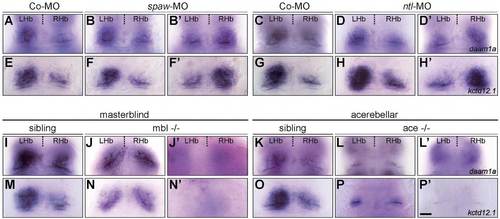
Habenular expression of daam1a and kcdt12.1 in embryos with affected habenular asymmetry. (A,C,I,K) Habenular expression of daam1a in embryos injected with Co-MO (A,C) and in siblings of masterblind (mbl) (I) and acerebellar (ace) (K) mutants. (E,G,M,O) Habenular expression of kcdt12.1 in embryos injected with Co-MO (E,G) and in siblings of mbl (M) and ace (O) mutants. (B,B′,F,F′) Injection of spaw-MO results in randomised laterality of habenular daam1a (B,B′) and kcdt12.1 (F,F′) asymmetric expression. (D,D′,H,H′) Injection of ntl-MO results in randomised laterality of habenular daam1a (D,D′) and kcdt12.1 (H,H2) asymmetric expression. (J,J′,N,N′) mbl-/- mutants show symmetric expression of daam1a (J) and kcdt12.1 (N), with both sides showing levels similar to the right Hb of controls; some embryos also show absence of expression (J′,N′). (L,L′,P,P′) ace-/- mutants show symmetric expression of daam1a (L) and kcdt12.1 (P), with both sides showing levels similar to the right Hb of controls; some embryos also show absence of expression (L′,P′). The relative contribution of the different phenotypes is given in Table 1. Images correspond to dorsal views of the habenular region at 96 hpf, with anterior to the top. Scale bar, 20 μm. |

Habenular expression of daam1a and kctd12.1 after Daam1a knock-down. (A,C) Expression of daam1a (A) and kcdt12.1 (C) in control embryos, revealing the enlarged asymmetric domain of the left Hb. (B-B′′) Global knock down of Daam1a results in equal proportions of asymmetric left-sided (B), asymmetric right-sided (B2), and bilateral-right symmetric (B′′) expression of daam1a. (D-D′′) Global knock down of Daam1a leads to equal proportions of asymmetric left-sided (D), asymmetric right-sided (D′), and bilateral-right symmetric (D′′) expression of kcdt12.1. The relative contributions of the different phenotypes are given in Table 2. Images correspond to dorsal views of the habenular region at 96 hpf, with anterior to the top. Scale bar, 20 μm. |

Efficiency of daam1a-MO local electroporation (Ep) in the habenular region. (A-C′) Distribution of lissamine-tagged daam1a-MO (red) locally electroporated into the left (A,A′), right (B,B′) and bilateral (C,C′) habenular regions (green) of Tg(ET16::GFP) embryos. Images correspond to dorsal views of maximum intensity z-stack confocal projections, with anterior to the top. Scale bar, 20 μm. |
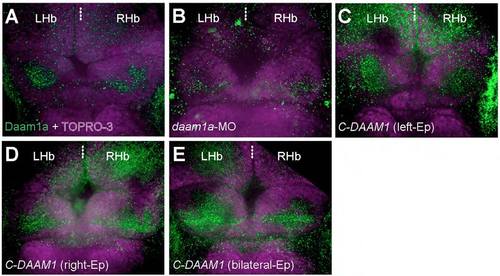
Changes in the relative levels of the endogenous Daam1a protein after local electroporation (Ep). (A) The Hb of control embryos labelled through indirect immunofluorescence against Daam1a (green) and counter stained with TO-PRO-3 to delineate the cellular context of the Hb (purple) showed a distinct punctate expression of Daam1a in the habenular neuropil, larger on the left compared to the right side at 96 hpf. (B) The Hb of embryos subjected to left-sided local electroporation of daam1a-MO show decreased levels of Daam1a expression at 96 hpf, primarily on the left Hb. (C) The Hb of embryos subjected to left-sided local electroporation of C-DAAM1 showed increased levels of Daam1a expression in the left Hb at 96 hpf. (D) The Hb of embryos after right-sided local electroporation of C-DAAM1 showed increase expression levels of Daam1a in the right Hb at 96 hpf, compared to controls. (E) The Hb of embryos subjected to bilateral local electroporation of C-DAAM1 showed increased levels of Daam1a expression in both left and right Hb at 96 hpf. Images correspond to dorsal views of maximum intensity z-stack confocal projections, with anterior to the top. Scale bar, 20 μm. |

Bilateral electroporation of daam1a-MO induces defects in neuropil formation and IPN connectivity. (A-F) Dorsal views of maximum intensity z-stack confocal projections of the habenular region (A-D) and IPN (E,F) in Tg(pou4f1-hsp70l:GFP) embryos at 4.5 dpf, with anterior to the top. The habenular neuropil was immunostained against acetylated α-tubulin (A,B, white), while the soma (C,D) and efferent projections (E,F) of dorsal habenular neurons expressing pou4f1-hsp70l:GFP were detected in vivo (green). Each column corresponds to a different condition of local electroporation: control-MO (left) and daam1a-MO (right). Asterisks in C and D indicate the enlarged cellular domain of the Hb expressing the pou4f1-hsp70l:GFP transgene. Scale bar, 20μm. |

Local electroporation of C-DAAM1 in the right habenular region induces increased axonal efferent connectivity to the IPN, without affecting habenular neuropil. (A-F) Dorsal views of maximum intensity z-stack confocal projections of the habenular region (A-D) and IPN (E,F) in Tg(pou4f1-hsp70l:GFP) embryos at 4.5 dpf, with anterior to the top. The habenular neuropil was immunostained against acetylated α-tubulin (A,B, white), while the soma (C,D) and efferent projections (E,F) of dorsal habenular neurons expressing pou4f1-hsp70l:GFP were detected in vivo (green). Each column corresponds to a different condition of local electroporation: control plasmid (left) and pcDNA-C-DAAM1-HA (right). Asterisks in C and D indicate the enlarged cellular domain of the Hb expressing the pou4f1-hsp70l:GFP transgene. Scale bar, 20μm. |