
- Title
-
Cross-species array comparative genomic hybridization identifies novel oncogenic events in zebrafish and human embryonal rhabdomyosarcoma
- Authors
- Chen, E.Y., Dobrinski, K.P., Brown, K.H., Clagg, R., Edelman, E., Ignatius, M.S., Chen, J.Y., Brockmann, J., Nielsen, G.P., Ramaswamy, S., Keller, C., Lee, C., and Langenau, D.M.
- Source
- Full text @ PLoS Genet.
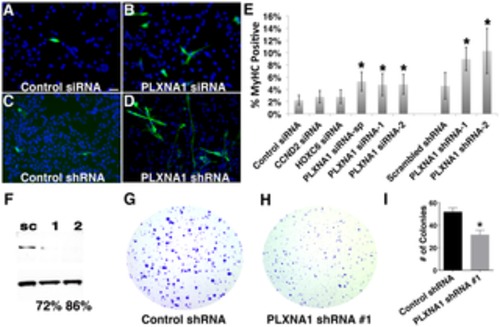
Figure 3. Knockdown of PLXNA1 induced differentiation and impaired anchorage-independent growth of human ERMS cells. RD cells stained with myosin heavy chain (MF20) and DAPI following culture under differentiation conditions for 72 hrs. (A) Control siRNA. (B) PLXNA1 smart-pool siRNA. (C) Control scrambled shRNA. (D) PLXNA1 shRNA-1. DAPI, blue; MF20-positive cell, green. (E) Quantification of MF-20 immunofluorescence in siRNA and shRNA-knockdown RD cells. Asterisk indicates significant differences between gene knock- down and control cells (p<0.05). Error bars denote standard deviation. (F) Western analysis of PLXNA1 shRNA stable knockdown; sc, scrambled control shRNA; 1, PLXNA1 shRNA-1; 2, PLXNA1 shRNA-2. A soft agar colony formation assay to assess PLXNA1 knockdown effects on anchorage-independent growth (G–I). (G) Control scrambled shRNA. (H) PLXNA1 shRNA. (I) Quantification of colony formation assay results. Error bar indicates standard deviation from triplicate experiments. |

Figure 4. Knockdown of PLXNA1 impairs migration of human ERMS cells. Representative images of ERMS cells transfected with gene-specific siRNAs at 0 hr (A, control siRNA; C, CCND2 siRNA; E, HOXC6 siRNA; G, PLXNA1 siRNA) and 22 hrs (B, control siRNA; D, CCND2 siRNA; F, HOXC6 siRNA; H, PLXNA1 siRNA) following gap creation. Scale bar indicates 100 µm. (I) Quantification of data from wound healing assay. Each error bar indicates standard deviation across 5–6 independent replicates. (J) A Transwell migration assay was performed in RD cells that stably express either a control shRNA or two independent PLXNA1 shRNAs. Migration was assessed after 24 hours. Each error bar indicates standard deviation across six fields at 200× magnification. Asterisks denote p<0. 05. |

Figure 5. Chemical inhibition of VEGF signaling by cediranib reduces ERMS growth in vivo. Syngeneic CG1 fish were transplanted with ERMS cells that co-expressed rag2-KRASG12D and rag2-dsRED. Fish with engrafted tumors were treated with DMSO vehicle (A–F) or 100 nM of cediranib for 7 days (G–L). Pre-treatment (A–C and G–I) and post-treatment images (D–F and J–L) of representative fish. Bright field (A,D,G,J), dsRED fluorescence (B,E,H,K) and merged image planes (C,F,I,L). Scale bar is 3 mm. (M) Quantification of relative volume change for individual animals. (N–O) fli1-GFP transgenic zebrafish were transplanted with dsRED-labeled ERMS and treated with DMSO (N) and cediranib (O). Scale bar equals 50 μm. (P) Microvessel density quantification. Asterisk indicates statistically significant difference between DMSO and cediranib-treated groups based on student t-test. Each error bar indicates standard deviation from 3 fields of microvessels for each animal. EDU incorporation analysis in DMSO (Q) or cediranib (R) treated fish. Scale bar is 50 μm. (S) Quantification of EDU analysis across each cohort of animals. Each error bar indicates standard deviation of percent EDU+ cells found within 3 fields for each animal. |
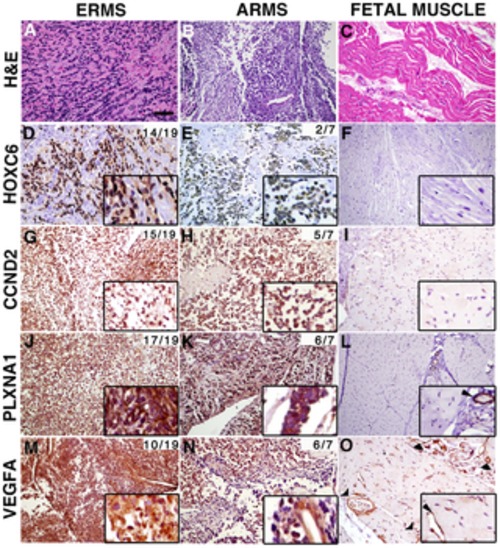
Figure 6. Genes contained within low copy CNAs are expressed in primary human rhabdomyosaroma but not normal fetal muscle. Immunohistochemistry of human primary RMS and fetal muscle tissue samples. Hematoxylin and Eosin stained sections (A–C). Expression of HOXC6, CCND2, PLXNA1 and VEGFA in embryonal rhabdomyosaroma (D, G, J, M), alveolar rhabdomyosaroma (E, H, K, N) and fetal muscle (F, I, L, O). Magnified views of staining are shown in insets. In fetal muscle, PLXNA1 and VEGFA are only expressed in the vasculature (examples indicated by arrowheads in L and O and corresponding insets). The cumulative frequency of positive staining within tumor subtype is shown in the top right corner of each panel (pediatric and adult samples combined). Scale bar (panel A) = 50 μm. |

Knockdown of PLXNA1 results in impaired migration in a wound-healing assay. Cells transfected with siRNA or shRNA were allowed to migrate over a scratch wound over 22 hours. Representative images of cells with control siRNA, two gene-specific PLXNA1 siRNAs, control shRNA and two gene-specific shRNAs at 0 hr (A–F) and 22 hrs (G–L) are shown. Scale bar indicates 50 μm. (M) Summary of assessing PLXNA1 knockdown in wound healing assays using two gene-specific siRNAs in RD and SMS-CTR cell lines. Eight random measurements at each time point were made for each siRNA. The ratio of wound closure was determined by the difference in distance migrated over total distance. Each error bar denotes standard deviation. (N) Summary of wound healing assays using two gene-specific PLXNA1 shRNAs. |