
- Title
-
DNA Methylation Profiling of the Fibrinogen Gene Landscape in Human Cells and during Mouse and Zebrafish Development
- Authors
- Vorjohann, S., Pitetti, J.L., Nef, S., Gonelle-Gispert, C., Buhler, L., Fish, R.J., and Neerman-Arbez, M.
- Source
- Full text @ PLoS One
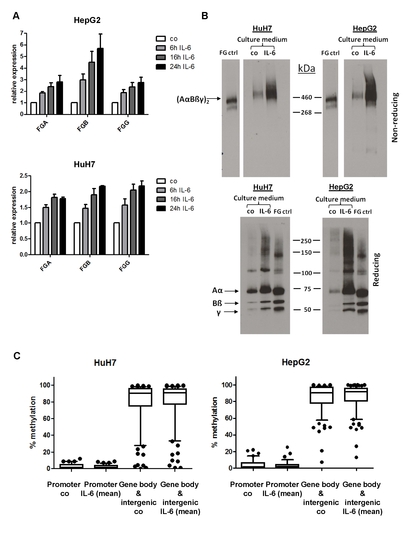
IL-6 treatment of HuH7 and HepG2 cells. (A) Quantitative RT-PCR: Relative expression of the three fibrinogen genes in HuH7 and HepG2 cells after treatment with 100ng/ml IL-6 for the indicated time. Each time point was normalized to the untreated control cells. The error bars represent the SEM of the relative expression of three biological replicates. (B) Western blot analysis of conditioned media from HuH7 and HepG2 cells under non-reducing and reducing conditions. FG ctrl: purified fibrinogen control; co: untreated control cells; IL-6: cells treated with 100ng/ml IL-6 for 24h. (C) Box-plots of the DNA methylation percentages for the promoter and gene bodies/intergenic group. To determine if IL-6 had a small effect on DNA methylation across a whole region, we grouped the CpGs according to their methylation status in untreated control cells. The average methylation was calculated across a “promoter” group consisting of CpG regions with low methylation percentage (≥ 3 CpGs with ≤ 30% DNA methylation) and a “gene bodies/intergenic” group (> 30% DNA methylation). The top and bottom of the boxes are the 75th and 25th percentile and the whiskers represent the 10-90th percentile. The DNA methylation profile of the untreated control cells is compared to the mean methylation profile of cells treated with 100ng/ml IL-6 for 6, 16 and 24h. |