
- Title
-
Cone photoreceptor types in zebrafish are generated by symmetric terminal divisions of dedicated precursors
- Authors
- Suzuki, S.C., Bleckert, A., Williams, P.R., Takechi, M., Kawamura, S., and Wong, R.O.
- Source
- Full text @ Proc. Natl. Acad. Sci. USA
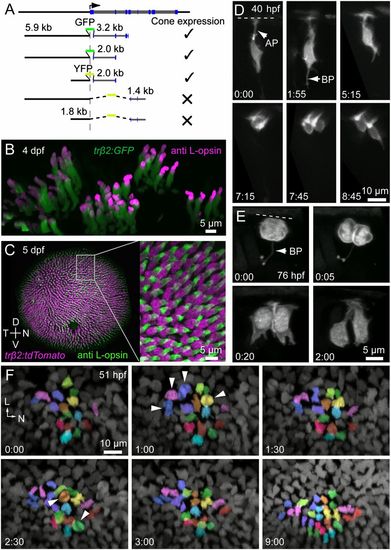
L cones are derived from symmetric precursor divisions. (A) Intron-1 of zebrafish trβ2 is essential for expression in cones. (B) Transient expression of FP driven by the trβ2 promoter is restricted to cones immunopositive for L-opsin. L-opsin signal is restricted to the outer segment, where GFP labeling is dim because there is little cytoplasmic space in this compartment (also see Fig. S1). L-opsin signal in GFP-expressing cells were isolated by digitally removing the opsin signal outside the GFP masks. (C) Only L cones are labeled in the stable transgenic line, Tg(trβ2:tdTomato). D, dorsal; N, nasal; T, temporal; V, ventral. (D) In vivo multiphoton time-lapse imaging reveals division of a trβ2:MYFP-labeled cell that produced two cones. (Time, hours:minutes.) AP, apical process; BP, basal process. The dotted line indicates the location of the outer limiting membrane (also in E). Cells were labeled by transient expression of trβ2:MYFP. (E) Imaging at more frequent intervals shows that the dividing cell has a short process that bifurcates at its terminal ending (BP). Cells were labeled by transient expression of trβ2:MYFP-2A-histone2AYFP. (F) Snapshots from a time-lapse sequence demonstrating the generation of L cones in a Tg(trβ2:tdTomato) fish. See Movie S1 for the full sequence. Postmitotic cones already present within the patch were not tracked. Each color represents a pair of L cones produced from a terminal division during the imaging period. Arrowheads indicate mitotic figures. L, lateral; N, nasal. EXPRESSION / LABELING:
|
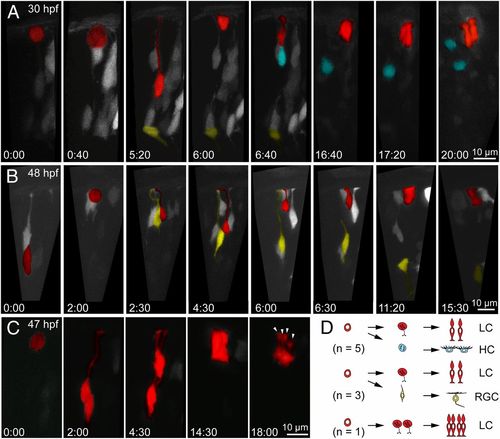
L-cone precursors are derived from different lineages. (A) Multiphoton time-lapse series showing sequence of cell division producing a ganglion cell (yellow), HC precursor (cyan), and L-cone precursor (red). (Time, hours:minutes.) See Movie S2 for the full time-lapse sequence. (B) Cell divisions producing a ganglion cell and an L-cone precursor. See Movie S3 for the full sequence. (C) Division producing a pair of L-cone precursors. Arrowheads indicate individual L cones produced from a common progenitor. (D) Schematic summarizing the lineages shared by L-cone precursors. LC, L cone; RGC, retinal ganglion cell. |
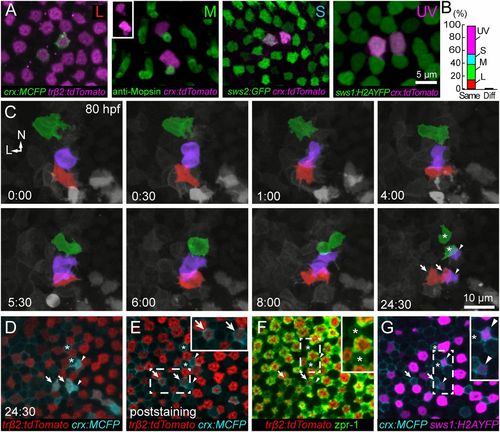
All cone types are generated from symmetric divisions. (A and B) Transient expression of crx:FP produces isolated pairs of labeled cones of the same type. Of 57 pairs, 56 pairs comprised the same cone type (cone pairs observed: 8, L cones; 14, M cones; 9, S cones; 25, UV cones). Only one pair comprised different cone types (L, S). Cone identities were obtained either using cone-specific transgenic lines [Tg(sws2:GFP) Tg(sws1:H2AYFP)] (50) or by M-opsin immunostaining. M-opsin was localized to the outer segments of a pair of crx:tdTomato-expressing cones (Inset). (C) Time lapse of Tg(sws1:H2AYFP, trβ2:tdTomato) fish injected with crx:MCFP at the one-cell stage. Shown here is a region in the dorsal retina where neighboring cell divisions gave rise to pairs of UV, M, and L cones. The precursor and the daughters for each cone type are colorized: UV (violet), M (green), and L (red). Symbols at the last time point in C mark each cone pair that was identified after fixation (D–G). See Movies S4 and S5 for the full time lapse and orthogonal views of the divisions. L, lateral; N, nasal. (D) Single-plane view of the last time point of the live-imaging series in C. (E) One of the cell pairs was trβ2:tdTomato-positive, and, thus, the cells were L cones (arrows). (F) Immunostaining using zpr1 revealed an M-cone pair (asterisks). (G) A UV-cone pair was identified by expression of sws1:H2AYFP (arrowheads). EXPRESSION / LABELING:
|

Production of pure L cones is regulated by trβ2 expression in cone precursors. (A) L-opsin–expressing cone numbers are diminished, whereas UV-opsin–expressing cone numbers are increased in animals injected with trβ2 morpholino (MO). L-opsin expression is rescued in the morphant when trβ2 is constitutively active under the crx or gnat2 promoters in the stable transgenic lines. Images were acquired at 5 dpf. (B) Quantification of the density of cones expressing each opsin type for the conditions in A (mean ± SEM). Numbers in parentheses indicate number of eyes. Significant differences are noted by asterisks (*P < 0.001); for each cone type, comparisons were made between trβ2 MO and the GeneTools standard control MO (Std MO) and between trβ2 MO and crx:trβ2/ trβ2 MO or gnat2:trβ2/ trβ2 MO. There was no significant difference in total photoreceptor density among Std MO (mean ± SEM in 100 μm2, 18.6 ± 0.3; n = 9 eyes), trβ2 MO (18.9 ± 0.2; n = 7), and gnat2:trβ2/ trβ2 MO (19.1 ± 0.3; n = 7). However, compared with the trβ2 MO, the density of photoreceptors in crx:trβ2/ trβ2 MO was increased (21.6 ± 0.7; n = 6; P = 0.005). (C) Double immunostaining for L-opsin and M-, S-, or UV-opsin in 5 dpf Tg(gnat2:MYFP-2A-trβ2) fish injected with trβ2 MO. Examples of cones expressing L-opsin and M- or UV-opsin are indicated by arrowheads. (D) Quantification of the proportion of each cone type that also expressed L-opsin (mean ± SEM). For example, (M + L)/M is the proportion of M cones coexpressing L-opsin. Numbers in parentheses indicate number of eyes. EXPRESSION / LABELING:
|
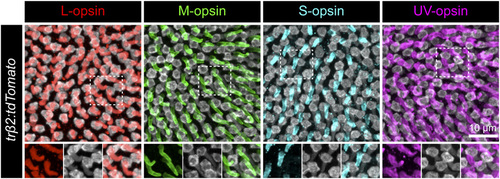
tdTomato-expressing cones in Tg(trβ2:tdTomato) retinas are positive for L-opsin but negative for M-, S-, or UV-opsin. Immunostaining for cone opsins in a Tg(trβ2:tdTomato) retina at 5 dpf. Individual channels of the regions outlined by the dotted box for each opsin are shown in the lower panels. Opsins are localized to the outer segments. Only L-opsin immunostaining colocalizes with tdTomato-positive outer segments. |

Comparison of FP expression in Tg(trβ2:XFP) lines with trβ2 mRNA expression across ages. (A) In situ hybridization (ISH) for trβ2 mRNA and expression of trβ2:MYFP enhanced by immunostaining with anti-GFP at 32 hpf, showing that both message and FP expression driven by the exogenous promoter are in progenitor cells at this age. D, dorsal; N, nasal; T, temporal; V, ventral. (B) Simultaneous labeling for trβ2 mRNA and tdTomato expression driven by the exogenous trβ2 promoter (anti-DsRed used to recover tdTomato signal). (Left) View of the excised retina from the back. Arrowhead indicates mitotic profiles. (Center) Magnified image of the mitotic profiles. (Right) Orthogonal view of the boxed region in the left image. Arrows indicate progenitor cells that colabel for message and tdTomato. Message appears to be reduced in cells at the apical surface (arrowheads). (C) In situ hybridization (Left) and trβ2:tdTomato expression (Right) at 4 dpf showing that both message and FP expression becomes restricted to cone photoreceptors. (D) En face view of 4-dpf photoreceptor layer showing both trβ2 mRNA and tdTomato expression driven by the exogenous trβ2 promoter. trβ2 mRNA was not observed in mitotic cells labeled with trβ2:tdTomato, indicating that trβ2 mRNA expression is likely to be regulated by the cell cycle, as observed previously in chick retina (10). We noticed that not all trβ2:tdTomato-expressing cells contained trβ2 mRNA signal (this was consistent across experiments). Because tdTomato is relatively stable, its fluorescence may not faithfully reflect temporal changes in trβ2 mRNA or protein expression. Indeed, in mice, TRβ2 protein distribution across the photoreceptor layer varies from mouse to mouse at around birth, in contrast to its more uniform distribution before and after this age (11). However, every cone in the 4-dpf zebrafish that expressed trβ2 message was labeled by trβ2:tdTomato. |
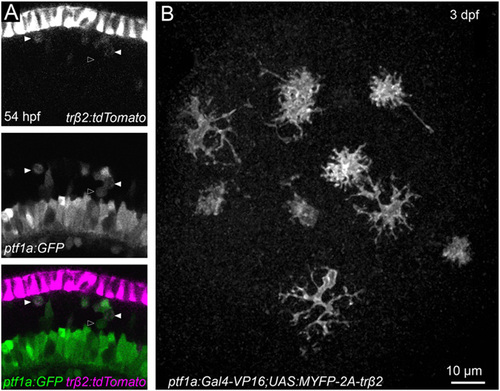
The majority of horizontal cells (HCs) are derived from trβ2:FP-positive cell lineage. (A) Confocal image of the retina of a double-transgenic line Tg (ptf1a:GFP; trβ2:tdTomato) at 54 hpf. HC precursors and HCs were identified by expression of GFP. Fluorescence driven by the exogenous trβ2 promoter is relatively weak in HC precursors undergoing cell division (arrowheads). Open arrowhead marks a mitotic cell without detectable trβ2:tdTomato signal. (B) Ectopic trβ2 in HC precursors and HCs by injecting Tg(UAS:MYFP-2A-trβ2) plasmid into one-cell stage fertilized eggs of Tg(ptf1a:Gal4-VP16) fish (12). At 3 dpf, HCs and amacrine cells were labeled by MYFP expression in the retinas and the morphology of MYFP-expressing HCs appeared normal. Therefore, developmental down-regulation of trβ2 in HC precursors and HCs is not essential for HC differentiation. EXPRESSION / LABELING:
|

Density of each cone type in roy retina. (A) Immunostaining for cone opsins in roy retinas. (B) Densities of each cone type and all photoreceptors. Densities of each cone type (mean ± SEM) are as follows: L cones, 6.6 ± 0.3; M cones, 4.0 ± 0.2; S cones, 3.0 ± 0.2; UV cones, 4.8 ± 0.2; all photoreceptors, 18.7 ± 0.5. The numbers in parentheses indicate the number of eyes. |

Morphologies and distributions of the major retinal cell types in the trβ2 MO. Knocking down trβ2 does not affect the generation of bipolar cells (BC), HCs (HC), amacrine cells (AC), retinal ganglion cells (RGC), or Muller glia (MG), visualized using transgenic animals in which these major cell types are labeled by FP expression (12–14). Retinas from GeneTools standard control morphant (Std MO) and trβ2 morphant are shown. INL, inner nuclear layer; IPL, inner plexiform layer; OPL, outer plexiform layer; PRL, photoreceptor layer; RGL, retinal ganglion cell layer. |

Time course of crx and gnat2 promoter activity in transient expression and stable transgenic lines. (A and B) FP expression driven by the crx or gnat2 promoter shown here in multiphoton image stacks of the eye at various ages. FP signal was first observed in the ventronasal patch at 38 hpf in Tg(crx:MCFP) animals. Subsequently, expression spread across the entire retina, localized to photoreceptors and bipolar cells. In contrast, FP expression driven by the gnat2 promoter was observed after 3 dpf, and expression was only observed in cones [also see Kennedy et al. (15)]. D, dorsal; N, nasal; T, temporal; V, ventral. (C) Cells from Tg(crx:MCFP) were transplanted into host embryos to facilitate tracking a small number of cells by time-lapse microscopy. Shown here is a 19-h duration time-lapse sequence (30-min intervals). MCFP expression is detected around 45 hpf and localized to cones and presumably dividing cone precursor cells. Fluorescence is also observed in differentiating bipolar cells (e.g., arrow). (D and E) To correlate the temporal expression of FP driven by the crx, gnat2, and trβ2 promoters, we crossed Tg(trβ2:tdTomato) with Tg(crx:MCFP) or Tg(gnat2:MCFP) animals. Confocal reconstructions of the region near the marginal zone. Note that MCFP signal is detected in dividing cells under the crx promoter but not under the gnat2 promoter. This suggests that, in the transgenic lines, crx-driven expression occurs at least at the stage of cone-precursor division, whereas gnat2-driven expression occurs in postmitotic cones. Orthogonal views shown represent views obtained along a line joining the two arrowheads. Nontrβ2:tdTomato-expressing cells also express FP under the crx or gnat2 promoters. The nasal side is toward the top of the images. |
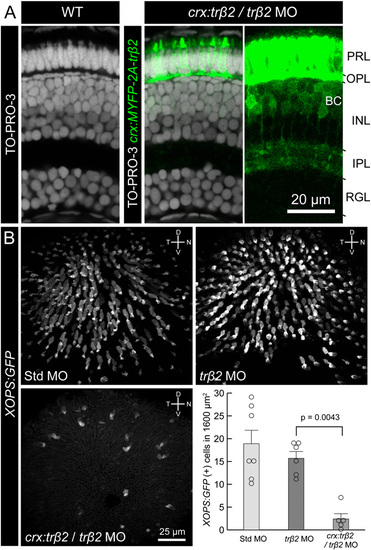
Ectopic expression trβ2 driven by the crx promoter decreases the density of rods. (A) trβ2 morphants rescued by trβ2 expression under the crx promoter (crx:trβ2/trβ2 MO) did not affect the laminar structure of the retina. Cell nuclei were stained with TO-PRO-3 (Invitrogen) in a wild-type retina (Left) and crx:trβ2/trβ2 MO retina (Center). (Right) Bipolar cells express trβ2 in crx:trβ2/trβ2 MO, but their axonal projections were not affected. MYFP signal in photoreceptors is saturated to demonstrate faint MYFP fluorescence in bipolar cell axons. INL, inner nuclear layer; IPL, inner plexiform layer; OPL, outer plexiform layer; PRL, photoreceptor layer; RGL, retinal ganglion cell layer. (B) Comparison of XOPS:GFP expression at 5 dpf between GeneTools standard control morphant (Std MO), trβ2 morphant, and crx:trβ2/trβ2 MO. The graph represents quantification of rod density (mean ± SEM). Circles indicate data from individual eyes. Statistical significance was determined using the Mann–Whitney rank-sum test. It is likely that the crx promoter used in this study is also active in rod precursors. The reduction of rods in crx:trβ2/trβ2 MO may be attributable to cell death of rod precursors or rods. Thyroid hormone induces cell death during metamorphosis in amphibians (16). Alternatively, a change in cell fate may have occurred because the density of photoreceptors increased in the “rescue” animal (see the figure legend of Fig. 4). |