
- Title
-
Transgenic tools to characterize neuronal properties of discrete populations of zebrafish neurons
- Authors
- Satou, C., Kimura, Y., Hirata, H., Suster, M.L., Kawakami, K., and Higashijima, S.
- Source
- Full text @ Development

Transgenic fish associated with neurotransmitter properties. All images were taken from fish that were 3.5 dpf. Genotypes of the transgenic fish are shown at the top of each panel. (A-C) Cross-sections of the spinal cord. Green and red cells do not overlap, indicating that each transgenic fish labels discrete cell populations. (D-G) Lateral views of the spinal cord. (D) Glycinergic neurons derived from dbx1b-positive progenitors are labeled by GFP. (E) GABAergic neurons derived from gsx1-positive progenitors are labeled by GFP. In D and E, neurons in which Cre-mediated recombination did not occur continued to express RFP. (F,G) Glutamatergic neurons (F) and glycinergic neurons (G) derived from dbx1b-positive progenitors are labeled by GFP. Only the green channel is shown. Scale bars: 10 μm (A-C); 20 μm (D-G). |

Progenitor domains in the dorsal spinal cord. Images were taken from embryos that were 36-48 hpf. All images are cross-sections of the spinal cord. Genotypes of the transgenic fish are shown at the top of each panel. (A) The atoh1a expression domain is located in the dorsal-most spinal cord. The short and long white lines show the dorsal and ventral neurog1 expression domains, respectively. The dorsal neurog1 expression domain is located just ventral to the atoh1a expression domain. (B) The gsx2 expression domain is located just ventral to the dorsal neurog1 expression domain. (C) The gsx2 and gsx1 expression domains are adjacent to each other. (D) The gsx1 and dbx2 expression domains are adjacent to each other. (E) In this image, the gsx1 expression domain is within the dbx2 expression domain (yellow). (F) The dbx1b expression domain is located in the middle of the dbx2 expression domain (yellow). (G) The gsx1 expression domain (red) and the dbx1b expression domain (yellow) are separate. (H) Summary of the domain organization. (I) Composite image of the expression domain of each transcription factor. For neurog1, only the dorsal expression domain is included. Scale bars: 10 μm. |
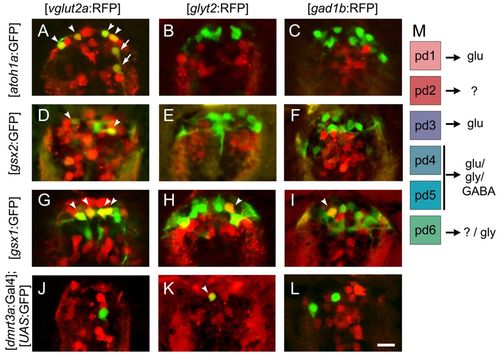
Neurotransmitter properties of neurons derived from dorsal progenitor domains. All images were taken from fish that were 3.5 dpf. All images are cross-sections of the spinal cord. Transgenic fish genotypes are shown at the top and left. Arrowheads and arrows show cells that are positive for both GFP and RFP. (A-C) atoh1a:GFP neurons are positive for vglut2a:RFP. (D-F) gsx2:GFP neurons are positive for vglut2a:RFP. (G-I) All three types of neurons (vglut2a:RFP, glyt2:RFP and gad1b:RFP) are present among gsx1:GFP neurons. (J-L) A GFP neuron driven by dmrt3a:Gal4 is positive for glyt2:RFP. (M) Summary of the neurotransmitter properties of neurons produced by dorsal progenitors. Scale bar: 10 μm. |
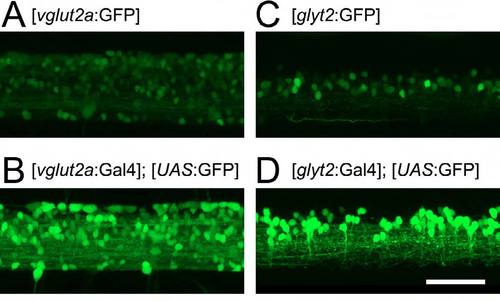
High levels of GFP expression driven by Tg[vglut2a:Gal4] and Tg[glyt2:Gal4]. Comparisons of GFP expression between the simple transgenic fish (Tg[vglut2a:GFP] and Tg[glyt2:GFP]) and the corresponding Gal4 transgenic fish. Images were taken from fish that were 3.5 dpf. (A,B) Lateral views of the spinal cord in the Tg[vglut2a:GFP] transgenic fish and the Tg[vglut2a:Gal4]; Tg[UAS:GFP] compound transgenic fish. Higher levels of GFP expression occurs in B. (C,D) Lateral views of the spinal cord in the Tg[glyt2:GFP] transgenic fish and the Tg[glyt2:Gal4]; Tg[UAS:GFP] compound transgenic fish. Higher levels of GFP expression occurs in D. Scale bar: 50 μm. |
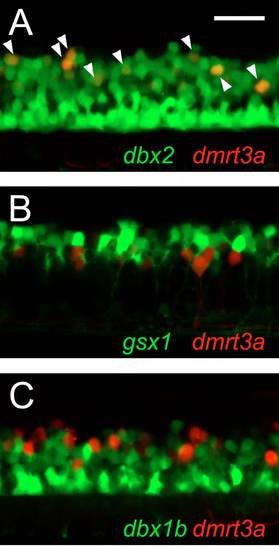
dmrt3a-positive neurons derive from the pd6 domain. Images are lateral views of the spinal cord at 3.5 dpf. (A)Tg[dbx2:GFP] and Tg[dmrt3a:RFP] compound transgenic fish. All the dmrt3a:RFP neurons are positive for dbx2:GFP (arrowheads). (B) Tg[gsx1:GFP] and Tg[dmrt3a:RFP] compound transgenic fish. None of the dmrt3a:RFP neurons is positive for gsx1:GFP. (C) Tg[dbx1b:GFP] and Tg[dmrt3a:RFP] compound transgenic fish. None of the dmrt3a:RFP neurons is positive for dbx1b:GFP. Scale bar: 50 μm. |

Fluorescent images of the entire body in the newly generated transgenic fish. (A-I) Images were taken from fish that were 3.5 dpf. |