
- Title
-
Knockdown of fbxl10/kdm2bb rescues chd7 morphant phenotype in a zebrafish model of CHARGE syndrome
- Authors
- Balow, S.A., Pierce, L.X., Zentner, G.E., Conrad, P.A., Davis, S., Sabaawy, H.E., McDermott, B.M., and Scacheri, P.C.
- Source
- Full text @ Dev. Biol.
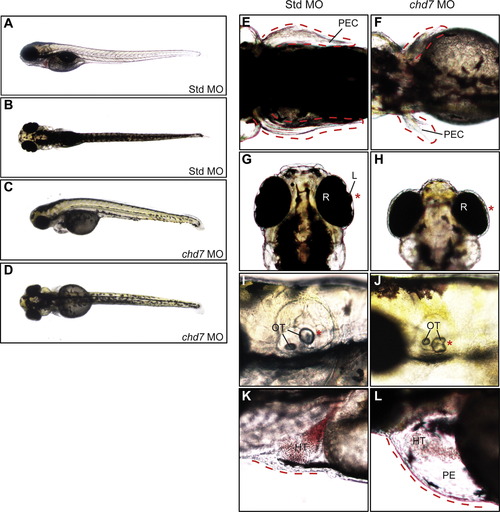
Zebrafish chd7 targeting results in CHARGE-like phenotypes. Whole-embryo lateral (A, C) and dorsal (B, D) views of representative Std control and chd7 morphant embryos at 4 dpf. The chd7 morphants display pectoral fin defects (E–F), eye abnormalities including under-developed or missing anterior eye structures (G–H), changes in otolith morphology (I–J), and pericardial edema (K–L). Missing or abnormal structures are highlighted with an asterisk (N) and/or dashed line. Structures are also highlighted in Std morphants for comparison. HT=heart, L=lens, OT=otolith, PE=pericardial edema, PEC=pectoral fin, and R=retina. PHENOTYPE:
|

chd7 morphants display variable defects in craniofacial cartilage development. (A–B) Bright-field lateral views of representative Std control morphants and chd7 morphants at 4 dpf. (C–D) Lateral and ventral views of Std morphants with wild-type craniofacial cartilage structures at 4 dpf. (F–G) Representative lateral and ventral views of the average chd7 morphant phenotype and is categorized as underdeveloped. The ceratohyal cartilages of the chd7 morphant are malformed and form a more linear shape. The five ceratobranchial cartilages were also undetectable with Alcian blue staining. (I–J) Lateral and ventral views of a severe chd7 morphant phenotype detected a highly underdeveloped neurocranium with the anterior and branchial arches absent. (E, H, K) Schematic views of the zebrafish craniofacial cartilage excluding the neurocranium. A solid red line indicates that the structure is present but malformed; while, a dashed red line indicates that the structure is absent. AC=auditory capsule, CB=ceratobranchial, CH=ceratohyal, EP=ethmoid plate, ME=Meckel′s cartilage, N=notochord, PC=parachordal, PEC=pectoral fin, PQ=palatoquadrate, and T=trabeculacranii. (For interpretation of the references to color in this figure legend, the reader is referred to the web version of this article.) PHENOTYPE:
|
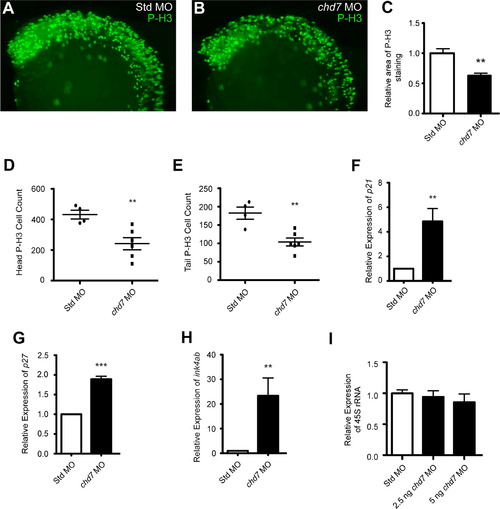
chd7 targeting impairs cell proliferation. (A–B) Lateral views of representative P-H3 stained zebrafish morphants at 25 hpf. (C) Quantification of the area occupied by P-H3 positive cells in chd7 morphants relative to P-H3 positive cells in Std morphants (n=5–6). (D–E) Graphs of P-H3 positive cell counts taken from confocal images of both the head and tail regions of Std and chd7 morphants (n=4–6). (F–H) Graphs of qRT-PCR data measuring gene expression of several cell cycle regulator genes at 25 hpf in chd7 morphants relative to Std morphants (n=5–6). (I) Expression of pre-rRNA in chd7 morphants at two separate morpholino dosages relative to Std morphants at 8 hpf (n=3). All error bars represent SEM. Significance for all graphs was determined with a Student′s two-tailed t-test and significant values are noted p<0.01 (**) and p<0.001 (***). |

Targeting of zebrafish fbxl10 transcript modulates pre-rRNA expression. (A) Schematic of the un-spliced fbxl10 transcript and the location of the fbxl10 morpholino (black bar). Injection of the morpholino results in an exclusion of exon 2 in the mature fbxl10 transcript and is predicted to induce a nonsense mutation (black arrow). Exclusion of exon 2 in the fbxl10 morphant transcript was confirmed by PCR. (B) Graph of qRT-PCR data measuring the expression of wild-type fbxl10 relative to the expression in Std control morphants at 8 hpf (n=4). (C–D) Representative lateral (C) and dorsal (D) bright-field images of fbxl10 morphants.(E–F) Lateral views of representative P-H3 stained zebrafish morphants at 25 hpf. (G) Quantification of the area occupied by P-H3 positive cells in fbxl10 morphants relative to P-H3 positive cells in Std morphants (n=12–13). (H) Graph of qRT-PCR expression data for 45S pre-rRNA relative in fbxl10 morphants relative to Std morphants (n=4). (I) Graph of qRT-PCR data measuring ink4ab expression relative to Std morphants (n=6).Error bars in all graphs represent SEM. Significance determined by a Student′s two-tailed t-test and significant values are noted p<0.05 (*) and p<0.01 (**). |
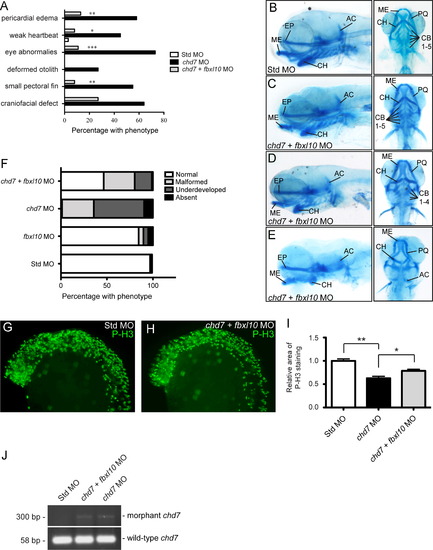
Modulation of fbxl10 expression rescues CHARGE-like phenotypes and improves cellular proliferation defects. (A) Graph of the percentage of observed CHARGE-like phenotypes across the different zebrafish morphants. Significance was determined by chi-square tests. (B–E) Lateral and ventral views of representative cartilage staining in the chd7/fbxl10 double morphants compared to controls (B) at 4 dpf including morphants with normal phenotypes (C), mild malformations of the ceratohyal (D), and chd7/fbxl10 double morphants with severe ceratohyal malformations and ceratobranchial cartilage were undetectable (E). (F) Graph of the frequency of the observed craniofacial cartilage phenotypes in the developing zebrafish. Zebrafish were categorized on the severity of the craniofacial cartilage defect. “Malformed” morphants had all cartilages present but displayed morphological changes in the ceratohyal. “Underdeveloped” morphants had no detectable ceratobranchial arches in addition to a malformed ceratohyal. A morphant was categorized “Absent” with no detectable anterior and branchial arches. A highly underdeveloped neurocranium was present in these morphants. (G–H) Lateral views of representative P-H3 stained zebrafish Std and chd7/fbxl10 morphants at 25 hpf. (I) Quantification of the area occupied by P-H3 positive cells in chd7 morphants (re-plotted from Fig. 4C) and chd7/fbxl10 morphants relative to P-H3 positive cells in Std morphants (n=7). (J) Representative image of the amplified PCR products of both wild-type and morphant chd7 transcripts from 8 hpf across the panel of morphants. Significant p-values in all graphs are noted p<0.05 (*), p<0.01 (**), p<0.001 (***). AC=auditory capsule, CB=ceratobranchial, CH=ceratohyal, EP=ethmoid plate, ME=Meckel′s cartilage, and PQ=palatoquadrate. PHENOTYPE:
|

Gene expression changes in cell-cycle regulators in chd7/fbxl10 double morphants. (A) Expression of pre-rRNA in chd7/fbxl10 double morphants and fbxl10 single morphants (re-plotted for comparison from Fig. 5H) relative to Std morphants at 8 hpf (n=3). (B-D) Graphs of qRT-PCR data measuring gene expression of several cell cycle regulator genes at 25 hpf across the panel of morphant embryos relative to Std morphants (n=5-6). Expression data for chd7 morphants re-plotted here from Fig. 4 F-H for comparison. Error bars represent SEM. Significance for all graphs was determined with a Student′s two-tailed t-test and significant values are noted p<0.05 (*), p<0.01 (**), p<0.001 (***). |
Sectioning of chd7 morphants reveals moderate to severe craniofacial cartilage abnormalities. (A–C) Alcian blue cartilage staining of 10 μm sectioned zebrafish embryos at 4 dpf. Staining revealed wild-type structures of Std morphants (A), while chd7 morphants (B–C) had many of the cartilaginous structures absent. Sectioning confirmed the common chd7 morphant phenotype does not develop all of the ceratobranchial cartilages (B). Staining of severe chd7 morphants only detected some development of the neurocranium (C). AC=auditory capsule, CB=ceratobranchial, CH=ceratohyal, EP=ethmoid plate, ME=Meckel′s cartilage, PC=parachordal, PQ=palatoquadrate, and T=trabeculacranii. PHENOTYPE:
|

Modulation of fbxl10 expression results in normal development of gross anatomical and craniofacial structures. (A–B) Lateral and dorsal bright-field images of 4 dpf fbxl10 morphants.(C–D) Whole-mount lateral and ventral representative images of fbxl10 morphant craniofacial structure. (E) Sagittal sectioning of Alcian blue stained craniofacial cartilage in a representative fbxl10 morphant. AC=auditory capsule, CB=ceratobranchial, CH=ceratohyal, ME=Meckel′s cartilage, PC=parachordal, PQ=palatoquadrate, and T=trabeculacranii. PHENOTYPE:
|

Changes in cellular proliferation correlate with embryonic head size. (A) A diagram indicating the locations of head measurements taken across the morphant zebrafish head region. Width measurements were taken across the forebrain (i) and midbrain (ii). The length of the zebrafish head was also measured from the anterior tip to the pectoral fins (iii). (i–iii) Graphs of the individual measurements for each morphant (n=7) correspond with the location on the diagram. All error bars represent SEM. Significance for all graphs were determined with a Student′s two-tailed t-test and significant values are noted p<0.05 (*), p<0.01 (**), p<0.001 (***). |
Sagittal sectioning of 4 dpf chd7/fbxl10 double morphants indicates variable restoration of ceratobranchial cartilage development. Bright-field images of 10 μm sagittal sections of representative chd7/fbxl10 double morphants. The chd7/fbxl10 double morphants were classified into three categories based on the degree of restoration in craniofacial development. These images are sections from representative double morphants from each category including normal (A), malformed (B), and underdeveloped (C). AC=auditory capsule, CB=ceratobranchial, CH=ceratohyal, EP=ethmoid plate, ME=Meckel′s cartilage, PC=parachordal, PQ=palatoquadrate, and T=trabeculacranii. |
Reprinted from Developmental Biology, 382(1), Balow, S.A., Pierce, L.X., Zentner, G.E., Conrad, P.A., Davis, S., Sabaawy, H.E., McDermott, B.M., and Scacheri, P.C., Knockdown of fbxl10/kdm2bb rescues chd7 morphant phenotype in a zebrafish model of CHARGE syndrome, 57-69, Copyright (2013) with permission from Elsevier. Full text @ Dev. Biol.