
- Title
-
Distinct enhancers of ptf1a mediate specification and expansion of ventral pancreas in zebrafish
- Authors
- Pashos, E., Tae Park, J., Leach, S., and Fisher, S.
- Source
- Full text @ Dev. Biol.

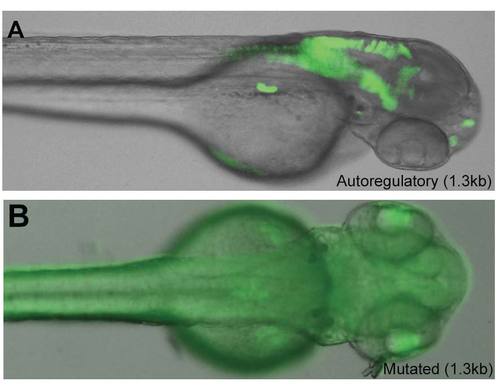
Identification of teleost ptf1a autoregulatory enhancers. (A) The diagram represents the predicted PTF1 binding sites upstream of the ptf1a coding sequence from the indicated teleost species; the red squares indicate E boxes (CANNTG) and the blue squares TC-boxes (TTCCC). (B) The transgenes generated for analysis of the autoregulatory enhancer are diagramed, including the exact sequences of the E and TC boxes of the two proximal sites, and the mutations introduced into them. Transgenes containing all three (C) or only the two proximal (D) PTF1 binding sites, in conjunction with the heterologous cFos minimal promoter, have similar activity to the entire ptf1a locus at 2 dpf (C), where they are active in the nervous system and pancreas (arrowhead), and at 5 dpf (D), where they show robust activity in the exocrine pancreas. The indicated mutations of the E-box and TC-box sequences abolish this activity (Supplementary Fig. 1). (E, F) A 90 bp synthetic enhancer containing the 3 predicted binding sites recapitulates this expression pattern at 2 dpf (E) and 5 dpf (F), but in addition is active in the retina, a site of endogenous ptf1a expression. medaka: O. latipes, stickleback: G. aculeatus, fugu: T. rubribes, tetraodon: T. nigroviridis, zebrafish: D. rerio. Scale bars: 200 μm. |
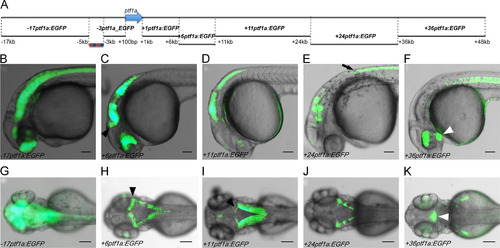
Survey of ptf1a locus for regulatory activity. (A) The diagram indicates the non-coding sequences, ranging in size from 3 to13 kb and collectively spanning the region between 17 kb and +48 kb of the transcriptional start site of ptf1a, which were assayed for enhancer activity. The isolated sequences showed transcriptional activity at 1 dpf (B–F) and 3 dpf (G–K) in regions of the nervous system and retina overlapping endogenous ptf1a expression. The 17ptf1a element located upstream of the autoregulatory enhancer drives non-specific neuronal expression at 1 dpf (B) and 3 dpf (G). The +6ptf1a enhancer is active in the retina, cerebellum (black arrowhead), hindbrain and spinal cord at 1 dpf (C) and 3 dpf (H). The +11ptf1a enhancer is also active in the hindbrain, including the cerebellum (black arrowhead), the spinal cord and more weakly in the retina (D: 1 dpf, I: 3 dpf). The +24ptf1a element activates expression in certain rhombomeres of the hindbrain and in the spinal cord (black arrow) (E: 1 dpf, J: 3 dpf). The +36ptf1a element is active in the retina, hypothalamus (white arrowhead), fin buds and notochord (F: 1 dpf, K: 3 dpf). Scale bars: 200 μm. |
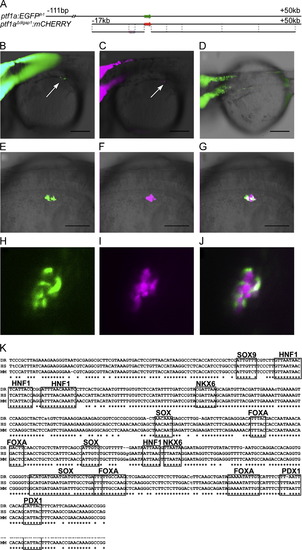
The early pancreatic ptf1a enhancer. (A) The diagram compares the previously published 111 kb to +50 kb ptf1a:egfp BAC transgene, to the truncated -17 kb to +50 kb ptf1aΔdlgap1:mcherry BAC, with only 17 kb of upstream sequence. (B) Expression of egfp from the longer BAC at 34 hpf completely overlaps mCherry expression from the shorter BAC (C), including early expression in the pancreas (arrows in B, C); this early pancreatic expression is not seen with the autoregulatory enhancer (D). (E) The +1ptf1a enhancer is active at 38 hpf in a cluster of cells surrounding the principal islet, marked by expression of the ins:mCherry transgene (F). (H–J) Confocal microscopy of embryos doubly transgenics for +1ptf1a:EGFP (H) and ins:mCherry (I) at 48 hpf show that the two cell populations are adjacent but do not overlap, as seen in a single 5 µM slice (J). (G) A 500 bp core of the +1ptf1a enhancer is highly conserved from mammals to teleosts, and contains predicted binding sites for a number of biologically relevant transcription factors, including Pdx1, Sox9, and Hnf1. DR: zebrafish, HS: human, MM: mouse. Scale bars: 200 μm. |

Activity of pancreatic ptf1a enhancers relative to the intact locus. Activity of the early +1ptf1a (B, D, G) and the autoregulatory (E, H) enhancers was assayed in transgenic embryos by in situ hybridization for egfp. For comparison, egfp expression is also shown for the intact locus in ptf1a:egfpjh1 transgenic embryos (A, C, F). At 30 hpf, none of the embryos had detectable expression in pancreatic precursors (data not shown). At 34 hpf (A, B) and 38 hpf (C–E), all ptf1a:EGFPjh1 embryos (n=24 and 40) showed a group of positive cells stretched across the midline from left anterior to right posterior (A, C), a subset of embryos transgenic for the early enhancer showed smaller groups of positive cells, in the left anterior endoderm (B, D), while all embryos transgenic for the autoregulatory enhancer lacked expression, shown at 38 hpf (E). At 42 hpf, ptf1a:egfpjh1 embryos had larger, less scattered groups of positive cells (F), while both the early enhancer (G) and the autoregulatory enhancer (H) were active in a subset of cells in the same domain. For all photographs, yolk was dissected away and the endoderm is shown from the ventral side; embryos are oriented with anterior to the left and left to the top. |
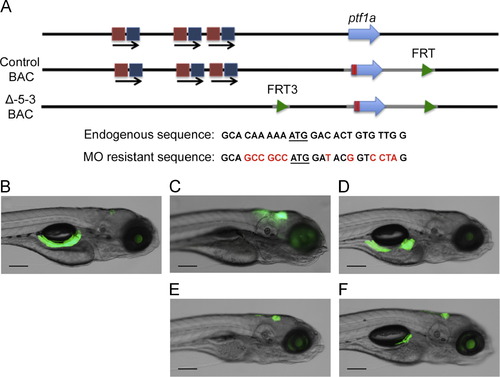
ptf1a autoregulation is required for exocrine pancreas development. (A) The diagram indicates the endogenous ptf1a locus (top line). In the control BAC (middle line) the ptf1a coding sequence was modified by synonymous substitutions and the addition of a Kozak sequence (at bottom) resulting in a transcript resistant to the translation blocking MO. The Δ-5-3 BAC has an additional 2 kb deletion removing the autoregulatory enhancer. (B) At 5 dpf, the ptf1a:egfp BAC shows robust expression in exocrine pancreas, as well as some hindbrain expression. In fish without a rescuing BAC, MO injection abolished exocrine pancreas development at 5 dpf (C), while the presence of the control BAC expressing MO-resistant ptf1a allowed complete (D) or partial (F) pancreas development at the same stage. In contrast, the Δ-5-3 BAC failed to rescue ventral pancreas development (E), although hindbrain expression was apparently normal. Scale bars: 200 μm. |
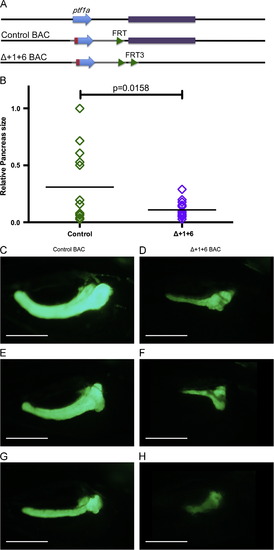
Loss of activity of the early +1ptf1a enhancer results in the formation of a hypoplastic pancreas. (A) The diagram indicates the endogenous ptf1a locus (top line). In the control BAC (middle line) the ptf1a coding sequence was modified by synonymous substitutions and the addition of a Kozak sequence (as in Fig. 5) resulting in a transcript resistant to the translation blocking MO. The Δ+1+6 BAC has a 5 kb deletion removing the early enhancer. (B) Pancreas size was measured at 5 dpf following an injection of ptf1a MO and either the control BAC or the Δ+1+6 BAC. (B) Rescues with the (Δ+1+6 BAC resulted in a significantly smaller pancreas size (p=0.0158). Three examples are shown of the maximum pancreata sizes measured at 5 dpf, after rescue with either the control BAC (C, E, G) or the BAC with the deletion of the early enhancer (D, F, H). Scale bars: 200 μm. |
|

|

|
Reprinted from Developmental Biology, 381(2), Pashos, E., Tae Park, J., Leach, S., and Fisher, S., Distinct enhancers of ptf1a mediate specification and expansion of ventral pancreas in zebrafish, 471-81, Copyright (2013) with permission from Elsevier. Full text @ Dev. Biol.