
- Title
-
Pdgfra protects against ethanol-induced craniofacial defects in a zebrafish model of FASD
- Authors
- McCarthy, N., Wetherill, L., Lovely, C.B., Swartz, M.E., Foroud, T.M., and Eberhart, J.K.
- Source
- Full text @ Development
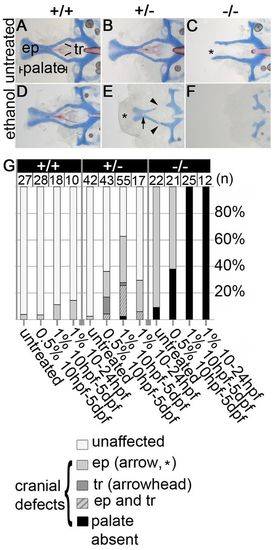
Ethanol exacerbates pdgfra mutant neurocranial defects and reveals haploinsufficiency. (A-F) Flat-mounted 5 dpf zebrafish neurocrania. Anterior is towards the left. (A,B) Untreated wild types and pdgfra heterozygotes develop normally. (C) Untreated pdgfra mutants have clefting of the ethmoid plate (asterisk), although the trabeculae are typically present. (D,E) Neurocrania of embryos treated with 1.0% ethanol from 10 hours post-fertilization (hpf) to 5 days post-fertilization (dpf). (D) Wild-type embryos are predominantly normal following ethanol treatment. (E) Ethanol-treated pdgfra heterozygotes display variable palatal defects, including partial clefting of the ethmoid plate (asterisk), holes in the ethmoid plate (arrow) and breaks in the trabeculae (arrowheads). (F) Ethanol-exposed mutants have an invariant and complete loss of the palatal skeleton. (G) Quantification of palatal defects across genotypes and treatments. ep, ethmoid plate; tr, trabeculae. PHENOTYPE:
|
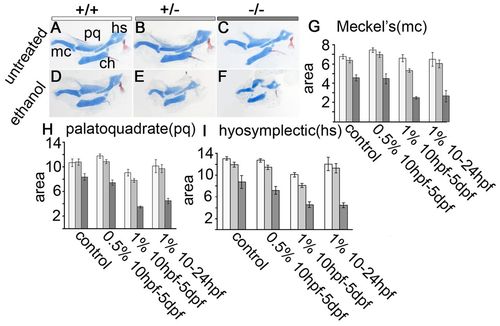
Ethanol induces pharyngeal hypoplasia in pdgfra mutants. (A-C) Flat-mounted jaw and jaw support elements, anterior towards the left. Untreated (A) wild-type, (B) pdgfra+/- and (C) pdgfra-/- embryos have normally shaped cartilages. (D,E) Treatment with 1.0% ethanol from 10 hpf to 5 dpf does not affect the overall shape of cartilages in (D) wild-type or (E) pdgfra heterozygous embryos. (F) Ethanol treatment greatly disrupts the shape of the palatoquadrate and hyosymplectic cartilages in pdgfra mutants. (G-I) Quantification of the average area, in thousands of μm2 of (G) Meckel’s (mc), (H) palatoquadrate (pq) and (I) hyosymplectic (hs) cartilages (standard error bars are depicted at 1.5 s.e.m., significance is indicated by non-overlapping bars; Moses, 1987). Wild type, light bar; pdgfra heterozygote, light-gray bar; pdgfra mutants, dark-gray bar. ch, ceratohyal. Group numbers are the same as for Fig. 1. PHENOTYPE:
|
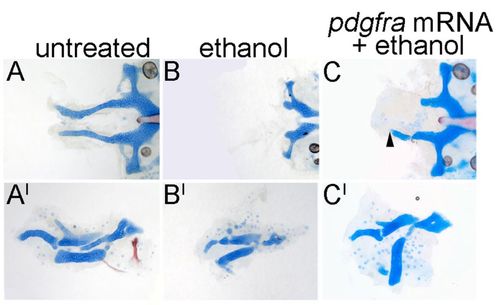
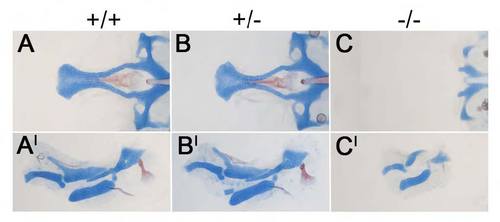
pdgfra mRNA partially rescues the ethanol-induced defects. (A-C) pdgfra mutant 5 dpf neurocrania. (A2-C2) Corresponding jaw and jaw support elements. Anterior is towards the left. (A,A2) Untreated pdgfra mutants typically have trabeculae (n=13/14). (B,B2) Ethanol treatment from 10-24 hpf causes trabeculae loss in all pdgfra mutants (n=10/10). (C,C2) pdgfra mRNA injection partially rescues the trabeculae (C, arrowhead, n=3/6), and the jaw and jaw support defects in 1.0% ethanol-treated pdgfra mutants (note the shape of the cartilage elements in C2). |
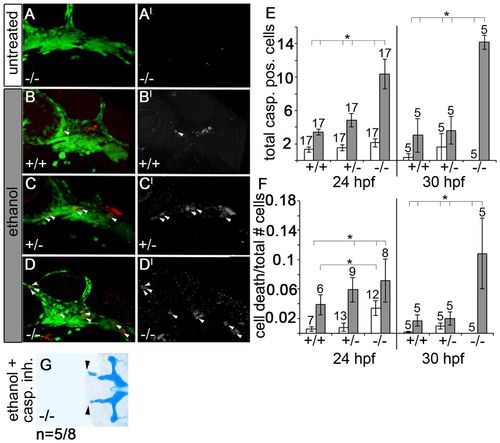
Ethanol-treated pdgfra mutants exhibit an increase in neural crest cell death. (A-D) Confocal images of 24 hpf anti-active caspase 3-stained fli1;EGFP embryos. (A2-D2) Active-caspase 3 staining alone. Anterior is towards the left. (A-C2) Untreated pdgfra mutants, ethanol-treated wild types and ethanol-treated heterozygotes have low levels of neural crest apoptosis. (D,D2) Ethanol-treated pdgfra mutants have greatly elevated levels of neural crest apoptosis. Arrowheads indicate apoptotic neural crest cells. (E) Quantification of cell death across genotypes at 24 hpf and 30 hpf, after ethanol was removed at 24 hpf (untreated control, light bars; ethanol, dark bars). Ethanol-treated pdgfra mutants show significant elevation in cell death compared with all other genotypes (one-way ANOVA, *Pd0.05). (F) Quantification of the ratio of cell death relative to total crest cells (untreated control, light bars; ethanol, dark bars; black bars above cell death ratio indicate significant differences using one-way ANOVA, *Pd0.05). (G) 5 dpf pdgfra mutant treated with 1.0% ethanol and 25 μM caspase inhibitor at 10-24 hpf. Arrowheads indicate partial rescue of the trabeculae (compare G with Fig. 1C,F). Group numbers are indicated above the bars in each graph. PHENOTYPE:
|

Elevating PI3K/mTOR signaling rescues the craniofacial defects in ethanol-treated pdgfra mutants. (A-F2) 5 dpf pdgfra mutant neurocrania (A-F) and the corresponding pharyngeal skeletal elements (A2-F2). (A,A2) Untreated mutants have clefting of the ethmoid plate (asterisk, n=10/10). (B,B2) Treatment with 1.0% ethanol at 10-24 hpf causes loss of the palatal skeleton and hypoplasia of the pharyngeal skeleton (n=12/12). (C-D2) pten morpholino (MO) injection rescues the craniofacial phenotypes of both (C,C2, n=4/4) untreated and (D,D2, n=8/20) ethanol exposed pdgfra mutants. (E,E2) Most L-leucine-treated mutants have trabeculae (n=12/17; five embryos lacked trabeculae). (F,F2) Supplementing ethanol-treated mutants with L-leucine causes rescue of the trabeculae (n=10/32). Arrowheads mark the partially rescued ethmoid plates. Asterisk in E indicates clefting of the ethmoid plate. PHENOTYPE:
|
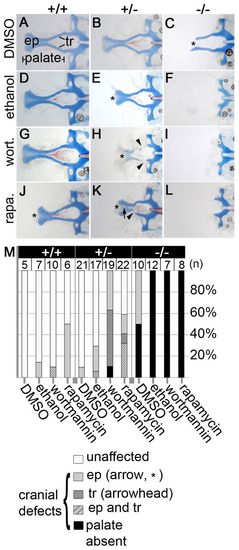
Wortmannin and rapamycin phenocopy ethanol-treated pdgfra mutants. (A-L) 5 dpf zebrafish neurocrania embryos were treated at 10-24 hpf with (A-C) DMSO, (D-F) 1.0% ethanol, (G-I) 1.5 μM wortmannin or (J-L) 3 μM rapamycin. Asterisks indicate ethmoid-plate defects (ep); arrowheads indicate trabeculae defects (tr). (M) Graph of percentage defects found in all three genotypes, across treatments. Unaffected, wild-type phenotype; ep, ethmoid-plate defects (arrow and asterisk in K); tr, trabeculae defects (arrowheads in H). PHENOTYPE:
|
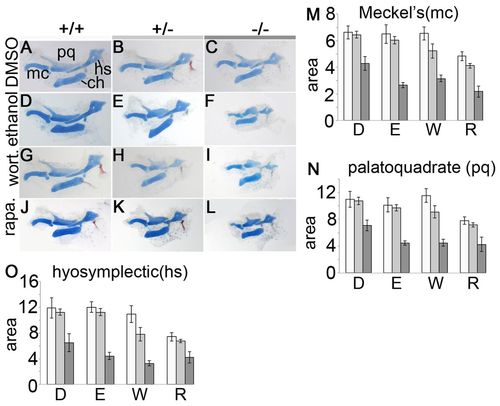
Wortmannin or rapamycin induces pharyngeal skeleton hypoplasia in pdgfra mutants. (A-L) Embryos were treated at 10-24 hpf with (A-C) DMSO, (D-F) 1.0% ethanol, (G-I) 1.5 μM wortmannin or (J-L) 3 μM rapamycin. (M-O) Graphs depict the average area sizes, in thousands of μm2 in (M) the Meckel’s (mc), (N) palatoquadrate (pq) and (O) hyosymplectic (hs) cartilages. D, DMSO; E, ethanol; W, wortmannin, R, rapamycin [standard error bars are depicted at 1.5 s.e.m., significance is indicated by non-overlapping bars (Moses, 1987)]. Wild-type, light bar; pdgfra heterozygote, light-gray bar; mutant, dark-gray bar; ch, ceratohyal. Group numbers are the same as for Fig. 6. PHENOTYPE:
|
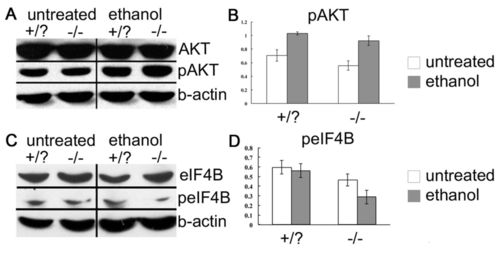
Ethanol alters phosphorylation of AKT and pEIF4B in pdgfra mutants. Heads of 24 hpf pdgfra mutant (-/-) and pdgfra sibling (+/?) from untreated controls or embryos treated with 1.0% ethanol from 10-24 hpf were used. (A) Immunoblot was stripped and reprobed for total AKT, phospho-AKT (pAKT) and β-actin as a loading control. Both ethanol-treated pdgfra siblings and pdgfra mutants have elevated levels of phospho-AKT compared with untreated counterparts. (B) Ratio of pAKT to total AKT across three immunoblots. (C) Immunoblot was stripped and reprobed for total eIF4B (eIF4B), phospho-eIF4B (peIF4B) and β-actin as a loading control. pdgfra mutants have decreased levels of phospho-eIF4B compared with untreated mutants, and both untreated and ethanol-treated siblings samples. (D) Ratio of phospho-eIF4B to total eIF4B across three immunoblots. |
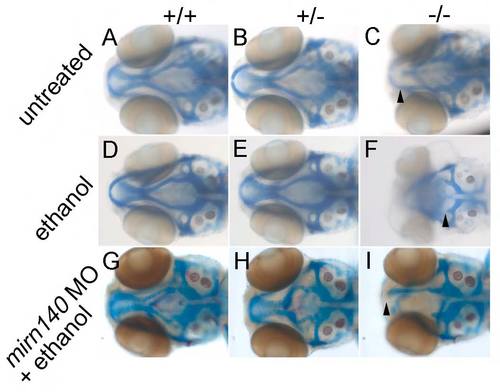
mir140 morpholino protects pdgfra mutants against ethanol-induced defects. (A-I) Dorsal views of 5 dpf zebrafish neurocrania stained for cartilage and bone using Alcian Blue and Alizarin Red, respectively. Anterior is towards the left. (A-C) Untreated embryos of each genotype. (D-F) Embryos from each genotype treated with 1.0% ethanol at 10-24 hpf. (G-I) Embryos injected with mir140 morpholino (MO) and treated with 1.0% ethanol from 10-24 hpf. Arrowhead indicates the distal tip of the trabeculae in the mutants in each treatment. PHENOTYPE:
|
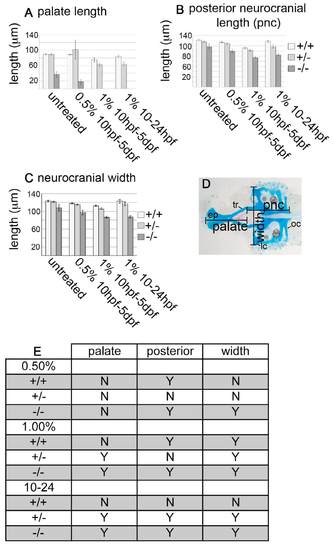
Ethanol-treatment causes a decrease in overall neurocranial length and width in pdgfra mutants. (A-C) Graphs depict the average (A) palate length, (B) posterior neurocranial length and (C) neurocranial width in μm. x-axis on all graphs indicate either untreated, 0.5% ethanol at 10 hpf-5 dpf, 1% ethanol from 10 hpf to 5 dpf, or 1% ethanol from 10 hpf to 24 hpf [standard error bars are depicted at 1.5 s.e.m., non-overlapping bars indicate significant differences (Moses, 1987)]. Wild type, light bar; pdgfra heterozygote, light-gray bar; mutant, dark-gray bar. (D) Alcian- and Alizarin-stained 5 dpf untreated wild-type neurocranium. Palate length was measured from the most anterior part of the ethmoid plate (ep) to the ends of the trabeculae (tr). The posterior neurocranium was measured from the most posterior part of the occipital arches (oc) to the ends of the trabeculae (tr). Neurocranial width was measured between the most lateral edges of the lateral commissures (lc). (E) Statistical analyses comparing the genotype/ethanol interactions with individual genotype and treatment controls. ‘Y’ indicates a significant difference. Wild-type (+/+) comparisons indicate whether there is a difference between treated and untreated wild-type embryos. pnc, posterior neurocranium. PHENOTYPE:
|
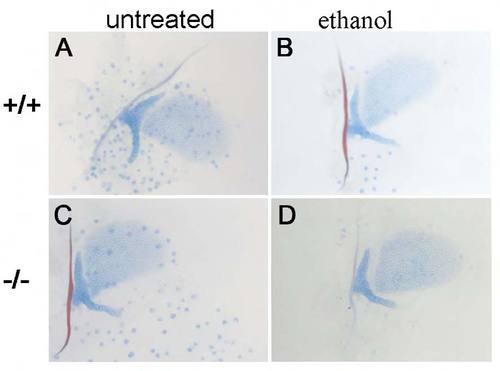
Ethanol treatment does not disrupt the pectoral fin in pdgfra mutants. (A-D) Fin cartilage elements, proximal towards the left, stained for cartilage and bone using Alcian Blue and Alizarin Red, respectively. Untreated (A) wild type and ethanol-treated (B) wild type. Untreated (C) pdgfra mutant and ethanol-treated (D) pdgfra mutant. Ethanol treatment of 1.0% from 10 to 24 hpf. PHENOTYPE:
|
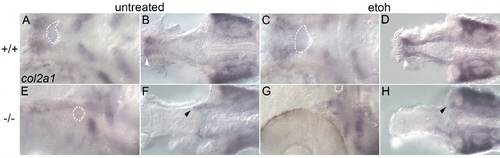
col2a expression is unaffected in cartilage elements not lost in ethanol-treated pdgfra mutants. (A-H) Ventral views of 48 hpf colIIa in situ hybridization images with anterior towards the left. (A,C,E,G) The oral ectoderm (outline in white dots) showing ventral cartilage structures. (B,D,F,H) The neurocranium. White arrowheads indicate the complete neurocranium in untreated and ethanol-treated wild-type siblings. Dark arrowheads label the most anterior region of the neurocranium in untreated and ethanoltreated mutants. With the exception of the ethmoid plate and the trabeculae, all precartilage condensations are present in ethanoltreated pdgfra mutants. |
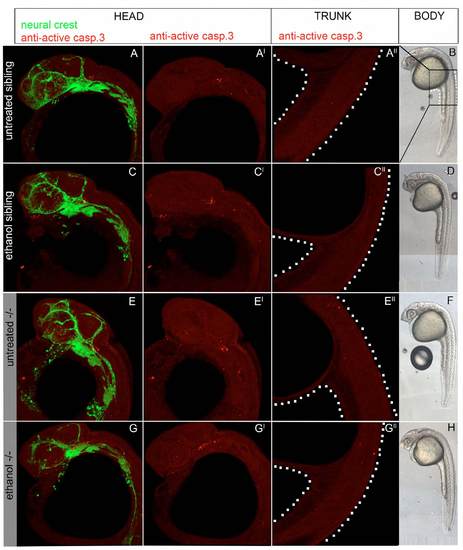
Ethanol treatment does not cause developmental delay or global increases in cell death in pdgfra mutants. (A-A3,CC3, E-E3,G-G3) 24 hpf embryos, anterior towards the left, stained for active caspase 3. There is no widespread elevation of apoptosis in the head or trunk of ethanol treated pdgfra mutants when compared with other groups. In A0, C0, E0 and G0 trunk and yolk are outlined by white dots. (B,D,F,H) DIC images of ethanol treated and untreated pdgfra mutants and siblings show that ethanol treated pdgfra mutants are not developmentally delayed and have no gross morphological defects at 24 hpf. PHENOTYPE:
|
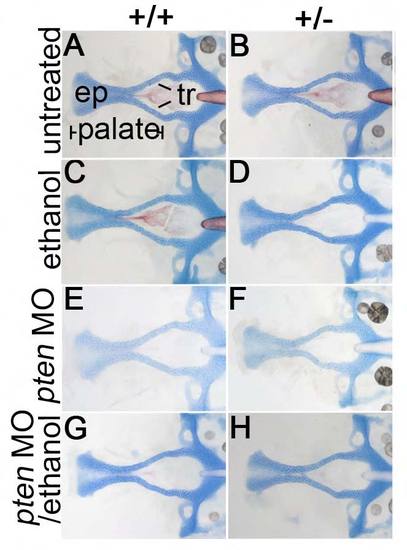
pten morpholino injection does not alter neurocranial development in untreated and ethanol-treated wild-type and pdgfra heterozygotes. Dorsal views of 5 dpf zebrafish neurocrania, stained for cartilage and bone using Alcian Blue and Alizarin Red, respectively. Anterior is towards the left. (A,B) Untreated controls. (C,D) 1.0% ethanol treatment at 10-24 hpf. (E,F) pten morpholino injections. (G,H) pten morpholino injections with 1.0% ethanol treatment at 10-24 hpf. The palate consists of the ethmoid plate (ep) and trabeculae (tr). |
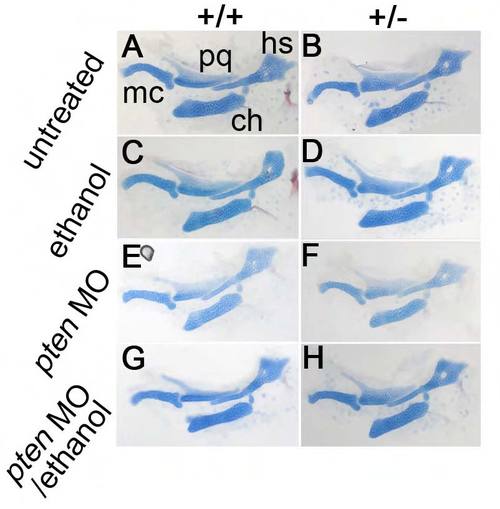
pten morpholino injections do not alter jaw and jaw support development in untreated and ethanol-treated wild-type and pdgfra heterozygotes. Flat-mount views of 5 dpf zebrafish jaw and jaw supports, stained for cartilage and bone using Alcian Blue and Alizarin Red, respectively. Anterior is towards the left. (A,B) Untreated controls. (C,D) 1.0% ethanol treatment at 10-24 hpf. (E,F) pten morpholino injections. (G,H) pten morpholino injections with 1.0% ethanol treatment from 10-24 hpf. Meckel’s cartilage (mc); palatoquadrate (pq); hyosymplectic (hs); ceratohyal (ch). |
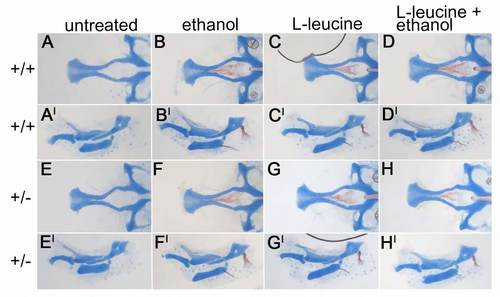
L-leucine does not alter the craniofacial skeleton of untreated and ethanol-treated wild-type and pdgfra heterozygotes. 5 dpf Alcian Blue and Alizarin Red-stained flat-mounted (A-H) neurocrania, and (A9-H9) jaw and jaw supports. (A,A′,E,E′) Untreated controls. (B,B′,F,F′) 1.0% ethanol treatment at 10-24 hpf. (C,C′,G,G′) 50 mM L-leucine treatment at 10-24 hpf. (D,D′,H,H′) 50 mM L-leucine with 1.0% ethanol treatment at 10-24 hpf. Anterior is towards the left. |
L-leucine treatment from 24 to 48 hpf does not rescue the ethanol-induced defects in 10-24 hpf treated mutants. (A-C′) Flat-mounted 5 dpf Alcian Blue- and Alizarin Red-stained (A-C) neurocrania and (A′-C′) jaw and jaw supports, Ethanol was administered at 10-24 hpf and 50 mM L-leucine was added at 24-48 hpf. (A,A′) Wild type; (B,B′) heterozygote; (C,C′) mutant. Anterior is towards the left. |
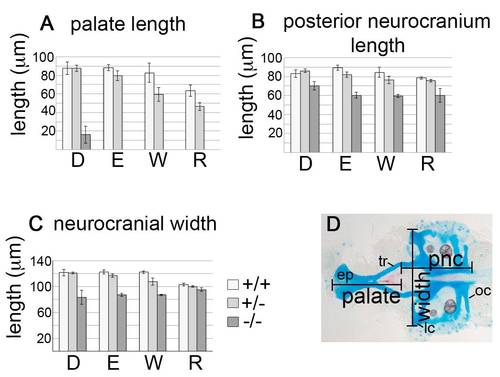
Both wortmannin- and rapamycin-treated pdgfra mutants show a decrease in overall neurocranial length and width. (A-C) Embryos were treated from 10-24 hpf with either DMSO, 1.0% ethanol, 1.5 μM wortmannin or 3 μM rapamycin. Inhibition of either PI3K or mTOR phenocopies the effects of ethanol. Graphs depict the average (A) palate length, (B) posterior neurocranial length and (C) neurocranial width in μm (standard error bars are 1.5 s.e.m., non-overlapping bars indicate significance; Moses, 1987). Wild-type, light bar; pdgfra heterozygote, light-gray bar; mutant, dark-gray bar. (D) An Alcian Blue- and Alizarin Red-stained 5 dpf untreated wild-type neurocranium. Palate length was measured from the most anterior part of the ethmoid plate (ep) to the ends of the trabeculae (tr). The posterior neurocranium was measured from the most posterior part of the occipital arches (oc) to the ends of the trabeculae (tr). Neurocranial width was measured between the most lateral edges of the lateral commissures (lc). D, DMSO; E, ethanol; W, wortmannin, R, rapamycin. |