
- Title
-
Expression of Arginine Vasotocin Receptors in the Developing Zebrafish CNS
- Authors
- Iwasaki, K., Taguchi, M., Bonkowsky, J.L., and Kuwada, J.Y.
- Source
- Full text @ Gene Expr. Patterns
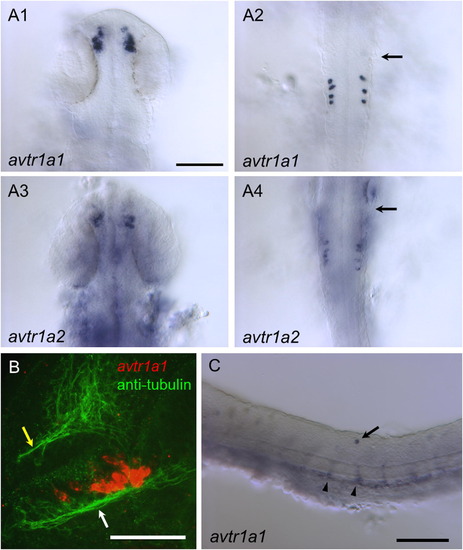
Vasotocin receptors (avtr1a1 and avtr1a2) are expressed in discrete populations of cells in the CNS of 24/28 hpf embryos. (A) Dorsal views (anterior up) of in situ hybridizations of 25 hpf embryos showing that both avtr1a1 and avtr1a2 are expressed in the forebrain (A1, A3) and the posterior hindbrain (A2, A4). Arrows denote position of the posterior border of the otocyst. Scale:100 µm. (B) Combined in situ hybridization (red) and anti-acetylated α tubulin labeling of axons (green) showing avtr1a1 expressing neurons in the forebrain appear to project axons into the postoptic commissure (white arrow) and tract of the postoptic commissure (28 hpf, lateral view with anterior right and dorsal up). Yellow arrow denotes the anterior commissure. Scale: 50 µm. (C) Lateral view of trunk of 24 hpf embryo showing avtr1a1 expressing neuron in the dorsal spinal cord (arrow) and apparent endothelial cells forming blood vessels (arrowhead). Scale: 100 µm. EXPRESSION / LABELING:
|

More neurons express avtr1a1 at 48 hpf. (A) View of the brain focused dorsally showing avtr1a1+ cells in the base of the epiphysis (II) and the forebrain/tectum boundary (III). Inset shows a higher magnification view of the cluster II avtr1a1+ cells with asterisk denoting the epiphysis and dotted line the midline. Scale: 100 µm for (A-C). (B) Same view focused more ventrally than (A) showing the avtr1a1+ cells at the forebrain/tegmentum boundary (IV) and two rough stripes of cells that cross the midbrain/hindbrain boundary (V and VI). (C) Same view focused even more ventrally showing the anterior forebrain avtr1a1+ cells (I). (D) Lateral view showing the avtr1a1+ cells in the anterior forebrain (I), near the dorsal midline of the forebrain (II), at the forebrain/tectum boundary (III), at the forebrain/tegmentum boundary (IV) and the lateral stripe near the midbrain/hindbrain boundary (VI). Outside the brain the pharyngeal arches (arrowhead) and a midline structure in between the eyes (arrow) also express avtr1a1. Scale: 100 µm. (E) View of eye showing avtr1a1+ cells (arrowhead) between the lens and the retina. Scale: 100 µm. EXPRESSION / LABELING:
|
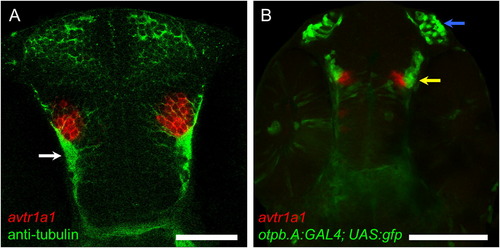
At 48 hpf the avtr1a1+ cells in the anterior forebrain (I) are the POC/TPOC neurons and not preoptic neurons. (A) Dorsal perspective (anterior up) of an embryo labeled with avtr1a1 riboprobe (red) and anti-acetylated α tubulin labeled axons (green) showing that the forebrain avtr1a1+ cells appear to extend axons in the TPOC (arrow). Scale: 50 µm. (B) A ventral perspective of an otpb.A:GAL4; UAS:gfp embryo labeled with avtr1a1 riboprobe showing that the anterior forebrain avtr1a1+ neurons (red) are located just medial to the preoptic neurons (green, yellow arrow). Blue arrow denotes the olfactory neurons that express GFP in the transgenic embryos. Scale: 100 µm. EXPRESSION / LABELING:
|
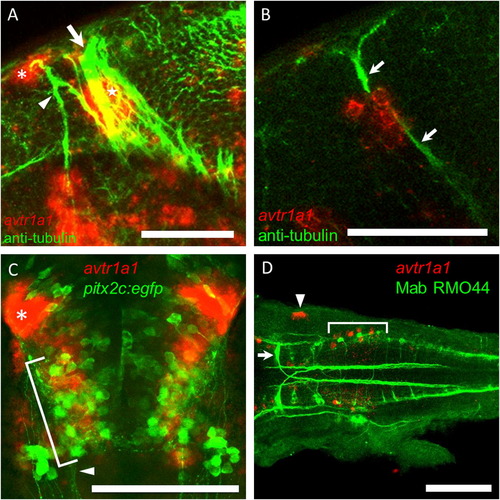
The epiphyseal and nucPC neurons but not the nucMLF nor T reticular neurons express avtr1a1 at approximately 48 hpf. (A) Lateral view (anterior left, dorsal up) of a z-stack of confocal images of an embryo double labeled for avtr1a1 and anti-acetylated α tubulin (axons) showing that the cluster II avtr1a1+ cells at the lateral base of the epiphysis (red, asterisk) project axons into the DVDT (green, arrowhead) and the avtr1a1+ cluster III cells (red, star) are adjacent to the PC (arrow). The avtr1a1+ cells seen ventrally are the neurons in the ventral forebrain and near the forebrain/tegmentum boundary (I and IV). Scale: 50 µm. (B) A single focal plane seen in a lateral view showing that the cluster III avtr1a1+ cells (red) appear to extend axons in the PC (green, arrows). Scale: 50 µm. (C) Ventral perspective of a pitx2c:egfp embryo labeled with a avtr1a1 riboprobe showing that the nucMLF neurons (green, bracket) do not express avtr1a1 (red). Arrowhead denotes the MLF; asterisk denotes the forebrain avtr1a1+ neurons. Scale: 100 µm. (D) Dorsal perspective (anterior left) of the hindbrain of an embryo double labeled for avtr1a1 riboprobe (red, bracket) and MAb RMO44 (green) showing that the posterior hindbrain avtr1a1+ cells are not the T reticular neurons. The arrowhead indicates avtr1a1+ cells in the otocyst. Scale: 100 µm. EXPRESSION / LABELING:
|

avtr1a2 is expressed in a pattern similar to avtr1a1 but they are not coexpressed by neurons. Dorsal perspective showing that avtr1a2 is expressed in the brain (arrow and arrowhead) (A) and hindbrain (D) at 48 hpf. Double in situ hybridizations for avtr1a1 and avtr1a2 shows that brain neurons generally do not coexpress avtr1a1 and avtr1a2 (B and C) nor do posterior hindbrain neurons (E and F) at 48 hpf. B and C are the same field of view from the same embryo as are E and F. Scale for A-D: 100 µm and for E-F: 50 µm. EXPRESSION / LABELING:
|
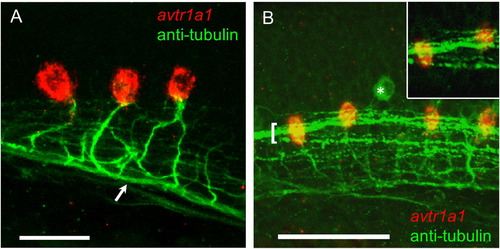
avtr1a1 expressing neurons in the caudal hindbrain project axons into the ipsilateral MLF and are in close proximity with the LLF at 28 hpf. (A) Lateral view (anterior left) showing caudal hindbrain, avtr1a1+ neurons (red) project axons (labeled with anti-acetylated α tubulin) into the ipsilateral MLF (arrow). Scale: 20 µm. (B) Lateral view showing that the LLF (green, bracket) courses over the avtr1a1+ neurons (red). Asterisk denotes a RB sensory neuron. Inset: single confocal plane showing LLF axons coursing over avtr1a1+ hindbrain neurons. Scale: 50 µm. EXPRESSION / LABELING:
|

avtr1a1+ neurons are in close proximity to the axons of otpb expressing preoptic neurons at 49-51 hpf. (A) Lateral view (anterior left) in an otpb.A:egfpcaax embryo showing that the anterior hindbrain avtr1a1+ neurons (red) are in close proximity to the axons of preoptic neurons in the MLCT (arrow). Scale: 50 µm. (B) Lateral view in an otpb.A:egfpcaax embryo showing that the avtr1a1+ neurons in the caudal hindbrain are in close proximity to the preoptic axons in the MLCT (arrow). Scale: 50 µm. EXPRESSION / LABELING:
|
Reprinted from Gene expression patterns : GEP, 13(8), Iwasaki, K., Taguchi, M., Bonkowsky, J.L., and Kuwada, J.Y., Expression of Arginine Vasotocin Receptors in the Developing Zebrafish CNS, 335-42, Copyright (2013) with permission from Elsevier. Full text @ Gene Expr. Patterns