
- Title
-
Pbx and Prdm1a transcription factors differentially regulate subsets of the fast skeletal muscle program in zebrafish
- Authors
- Yao, Z., Farr, G.H., Tapscott, S.J., and Maves, L.
- Source
- Full text @ Biol. Open
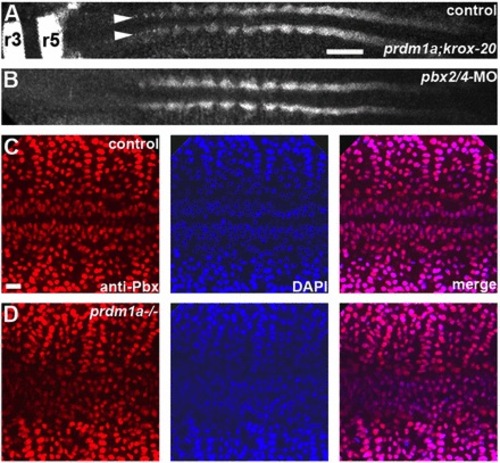
(A,B) RNA in situ expression of prdm1a and krox-20 in (A) control and (B) pbx2/4-MO embryos. prdm1a expression in the adaxial cells along the axis of the embryo is maintained, while krox-20 expression is lost, in pbx2/4-MO embryos. Arrowheads point to adaxial cells, and r3 and r5 indicate krox-20 expression in hindbrain rhombomeres. (C,D) Anti-Pbx (red) and DAPI (blue) staining, along with merged images, in (C) control and (D) prdm1a-/- embryos. Pbx expression is maintained in prdm1a-/- embryos. All embryos are shown in dorsal view, anterior towards the left. Scale bars: (A) 50 μm, (C) 10 μm. EXPRESSION / LABELING:
|

(A,C,E) RNA in situ expression of (A) mylpfa and krox-20, (C) myhz1.3 and krox-20, and (E) myog and krox-20 in green, smyhc1 in red, and merged images in control, pbx2/4-MO, prdm1a-/-, and pbx2/4-MO;prdm1a-/- embryos. krox-20 expression is included as a control for the pbx2/4-MO knockdown (Maves et al., 2007). r3 and r5 indicate krox-20 expression in hindbrain rhombomeres. smyhc1 is downregulated in prdm1a-/- embryos (Elworthy et al., 2008; von Hofsten et al., 2008). (A,C) embryos are at 14 somites, (E) embryos are at 10 somites. All embryos are shown in dorsal view, anterior towards the left. Somites were counted in all embryos shown to confirm consistent staging. (B,D,F) Graphs of real-time RT-PCR (qRT-PCR) expression levels for (B) mylpfa, (D) myhz1.3, and (F) myog. Expression levels were normalized to odc1 expression. Error bars represent standard deviation. Somite stages (14s, 10s) are shown. Scale bar: 50 μm. EXPRESSION / LABELING:
|
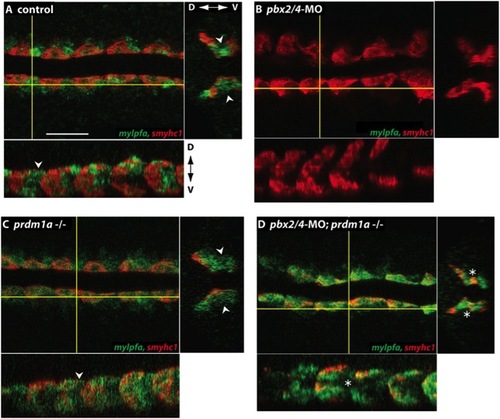
RNA in situ expression of mylpfa (green) and smyhc1 (red) in (A) control, (B) pbx2/4-MO, (C) prdm1a-/-, and (D) pbx2/4-MO;prdm1a-/- embryos. Embryos are 14 somites stage, shown in dorsal view, anterior towards the left. Somite numbers 2–7 are shown for each embryo. Yellow lines indicate where optical sections are taken through the x and y planes (lower and right panels, respectively, each image). Dorsal–ventral (D–V) axes (z axis in xy view) are indicated. Arrowheads point to lateral domain of mylpfa expression, absent or reduced in pbx2/4-MO and pbx2/4-MO;prdm1a-/- (asterisk) embryos. smyhc1-overlapping mylpfa expression in adaxial cells is present in pbx2/4-MO;prdm1a-/- embryos. Scale bar: 50 μm. EXPRESSION / LABELING:
|
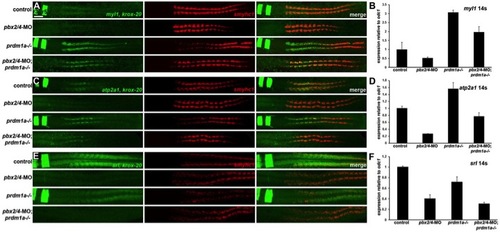
(A,C,E) RNA in situ expression of (A) myl1 and krox-20, (C) atp2a1 and krox-20, and (E) srl and krox-20 in green, smyhc1 in red, and merged images in control, pbx2/4-MO, prdm1a/, and pbx2/4-MO;prdm1a-/- embryos. krox-20 expression is included as a control for the pbx2/4-MO knockdown (Maves et al., 2007). r3 and r5 indicate krox-20 expression in hindbrain rhombomeres. smyhc1 is downregulated in prdm1a-/- embryos (Elworthy et al., 2008; von Hofsten et al., 2008). (A,C) embryos are at 14 somites, (E) embryos are at 18 somites. All embryos are shown in dorsal view, anterior towards the left. Somites were counted in all embryos shown to confirm consistent staging. (B,D,F) Graphs of real-time RT-PCR (qRT-PCR) expression levels for (B) myl1, (D) atp2a1, and (F) srl. Expression levels were normalized to odc1 expression. Error bars represent standard deviation. Somite stage for qRT-PCR (14s) is shown. Scale bar, 50 μm. EXPRESSION / LABELING:
|