
- Title
-
Interactions with Iridophores and the Tissue Environment Required for Patterning Melanophores and Xanthophores during Zebrafish Adult Pigment Stripe Formation
- Authors
- Patterson, L.B., and Parichy, D.M.
- Source
- Full text @ PLoS Genet.
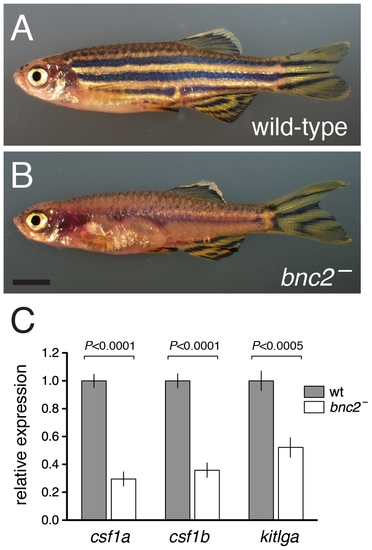
bnc2 mutants exhibited reduced expression of melanogenic and xanthogenic factors. (A) Wild-type. (B) Homozygous bnc2 mutant. (C) Quantitative RT-PCR for csf1a, csf1b, and kitlga revealed significantly reduced transcript abundances in skins isolated from 8.5 SSL bnc2 mutants as compared to stage-matched, wild-type bnc2/+ siblings. Shown are means±SE. Values are derived from 3 replicate experiments each consisting of 3 biological replicates for each genotype (n = 9 larvae total per genotype). Scale bar: in (B) 3 mm for (A,B). PHENOTYPE:
|

Re-expression of Kitlga, Csf1a, and Csf1b in bnc2 mutants promoted melanophore and xanthophore development but was insufficient for stripe patterning. (A) Melanophore recovery following heat-shock induction of Tg(hsp70l:kitlga). Although Kitlga expression increased melanophore numbers in bnc2 mutant larvae, the restored melanophores failed to develop into stripes. Plots show means±SE with different letters above bars denoting means that differed significantly from one another in Tukey Kramer post hoc comparisons. All wild-type larvae are bnc2/+ siblings to bnc2 mutants. Sample sizes: bnc2/+, n = 10; bnc2, n = 10, bnc2/+ hsp70l:kitlga, n = 14; bnc2 hsp70l:kitlga, n = 14. (B) Xanthophore and melanophore recovery following heat-shock induction of Tg(hsp70l:csf1a). Upper plot, xanthophores were classed as either associated with iridophores (larger, lower segment of each bar), or not associated with iridophores (smaller, upper segment of each bar): total xanthophore numbers, including xanthophores not associated with iridophores were increased in bnc2 mutants by Csf1a expression. Lower plot indicates that melanophore numbers were increased as well. Images show xanthophores (yellow–orange cells) over iridophores (patches of grey cells in this illumination, denoted by blue arrowheads in the bnc2 mutant). Red dashed circle in bnc2 mutant +Csf1 panel shows a xanthophore that has developed at a distance from iridophores. Lower magnification images (bottom) show typical patterns and the absence of organized stripes in the bnc2 mutant after Csf1 expression, despite increased numbers of melanophores and xanthophores (compare to controls in A). Sample sizes: bnc2/+, n = 15; bnc2, n = 19, bnc2/+ hsp70l:csf1a, n = 19; bnc2 hsp70l:csf1a, n = 22. Results for Tg(hsp70l:csf1b) were equivalent (not shown; total sample size, N = 17). (C) Xanthophore and melanophore numbers were restored by heat shock induction of Tg(hsp70l:kitlga-csf1a) and Tg(hsp70l:kitlga-csf1b) yet stripes failed to form (total sample sizes, N = 7, 12, respectively). Scale bars: in (A) 500 μm for (A); in (B, upper) 80 μm for (B upper for images); in (B, lower) 500 μm for (B bottom 2 images); in (C) 500 μm for (C). PHENOTYPE:
|
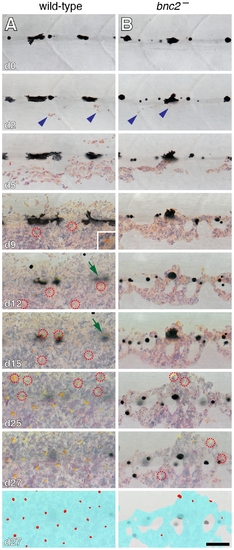
Interstripe xanthophores developed after iridophores in wild-type larvae and were further delayed in bnc2 mutants. Shown are a representative wild-type (bnc2/+) larva (A) and a sibling bnc2 mutant (B) imaged repeatedly over 27 d beginning at 6.0 SSL, just prior to the appearance of iridophores at the anteroposterior region imaged, dorsal to the anus. In both the wild-type and the bnc2 mutant iridophores started to appear by day 2 of imaging (blue arrowheads). Xanthophores started to differentiate by day 9 of imaging in wild-type; newly arising xanthophores are indicated by red dashed circles. In contrast, xanthophores did not appear until day 25 of imaging in the bnc2 mutant. As iridophores (and xanthophores) in the interstripe became more abundant, some early larval melanophores along the horizontal myoseptum disappeared from view (e.g., green arrows in A, d12 and d15). For easier visualization of melanophores and other cell type, fish were treated briefly with epinephrine immediately prior to imaging, which contracts melanosomes towards the cell body; the distribution of melanin thus indicates the centers of melanophores whereas processes extending out from the cell body are not visible. Bottom panels schematize the distribution of iridophores (light blue) and xanthophores (red) on the final day shown. Samples sizes for which complete image series were obtained were: bnc2, n = 4; bnc2/+, n = 6. Scale bar: in (B, d27) 80 μm for (A,B). PHENOTYPE:
|

Ablation of iridophores by Mtz treatment of fish injected with pnp4a:NTR. (A) Iridophores in a wild-type larva (6.5 SSL) were marked by Venus fluorescence following injection of pnp4a:nlsVenus-V2a-NTR plasmid as the 1-cell stage, as shown in bright-field (A), fluorescence (A2) and merged (A3) views. (B–D) The same larva following Mtz treatment exhibited fewer, rounded iridophores that were progressively lost over several days. Inset in B shows reflecting-platelet containing extrusion bodies at the surface of the epidermis. Scale bar: in (A3) 60 μm for (A–D). |

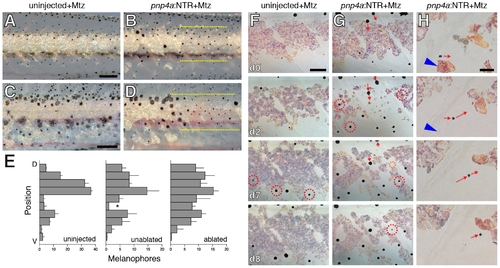
Iridophore ablation perturbed xanthophore and melanophore patterning. (A, B) Wild-type siblings that were either not injected (A) or injected (B) with pnp4a:NTR plasmid and then treated with Mtz beginning at 5 SSL, prior to the the onset of xanthophore differentiation. Controls (A) exhibited normal interstripe iridophores and xanthophores whereas iridophore-ablated individuals developed xanthophores primarily in association with residual iridophores (e.g., dashed red circle in B). (C) Numbers of xanthophores (means±SE) in stage-matched siblings treated with Mtz that were either uninjected or injected with pnp4a:NTR plasmid. Xanthophore numbers did not differ between groups at the onset of the experiment but iridophore-ablated individuals showed an increasingly severe xanthophore deficiency compared to uninjected larvae as the experiment proceeded (genotype×day interaction, F1,10 = 2.7, P<0.005; initial sample sizes: uninjected, n = 13; pnp4:NTR, n = 13). During later development, new xanthophores ultimately developed more broadly over the flank and in association with regenerating iridophores; iridophore ablations after xanthophores had differentiated typically did not affect these cells (not shown). (D–F) Examples of larvae (9.5 SSL) exhibiting melanophore patterning defects following earlier iridophore ablations (started at 6.0 SSL). Melanophores have colonized regions from which iridophores were ablated, though a few regenerative or persisting iridophore remained. In the lighting used here, iridophores are blue or gold iridescent. (D) Melanophores occupy a region from which iridophores were ablated (residual or regenerated iridophores outlined by dashed yellow lines). Green arrowhead, one of several melanophores localized adjacent to remaining iridophores. Fish shown in A, C and D were treated with epinephrine prior to imaging. (E) Melanophore stripes are broken at site of iridophore ablation and melanophores appear to “wrap around” residual interstripe iridophores on either side of the ablation. (F) In another individual, melanophores stripes are constricted where iridophores have been ablated (arrow). Close-up in F2. Fish in E and F were not treated with epinephrine, so that melanin reveals peripheral processes of melanophores. Most small melanophores in dorsal regions are associated with developing scales and will not contribute to the stripe pattern [45]. (Total sample size, N = 40.) Scale bars: in (B) 60 μm for (A,B); in (D) 200 μm for (D); in (E) 500 μm for (E); in (F) 100 μm for (F); in (F2) 60 μm for (F2). |
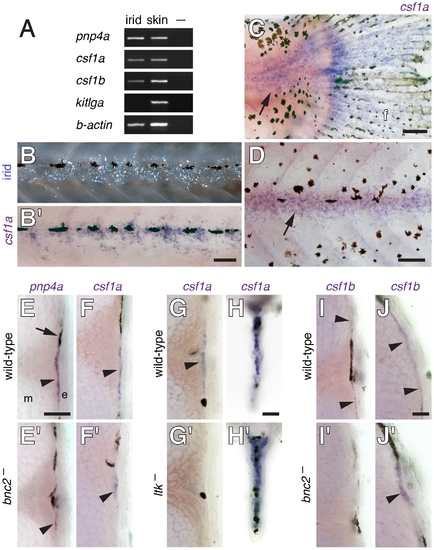
csf1a and csf1b were expressed by interstripe iridophores as well as hypodermal and fin cells. (A) RT-PCR of isolated iridophores (irid) and skin containing pigment cells for the iridophore marker pnp4a as well as csf1a, csf1b and kitlga. –, no template control. See text for details. (B) A larva (~6 SSL) imaged to show iridophores prior to fixation (upper) and after whole-mount staining for csf1a transcript. Not all iridophore reflecting platelets are visible and platelets that are apparent may not precisely delineate cell bodies and processes. (C,D) Whole-mount larvae (~8.5 SSL) stained for csf1a transcript. (C) csf1a was expressed in the posterior trunk at the base of the caudal fin (arrow) where a patch of posterior iridophores develops [45] and also within the fin (f). (D) csf1a staining near the horizontal myoseptum (arrow). (E–J) In situ hybridizations on vibratome cross-sections through the midtrunk (~7 SSL). (E,E2) pnp4a staining indicated iridophore locations (arrowheads) within the hypodermis of wild-type (bnc2/+) larvae (E) and revealed fewer of these cells in bnc2 mutants (E2). Arrow, melanophore. (F,F2) csf1a staining (arrowheads) was reduced in bnc2 mutants. (G–H) Staining for csf1a in wild-type (ltk/+) and ltk mutants, which lack iridophores. (G,G2) csf1a staining was absent in ltk mutants at the location where iridophores are found in the wild-type (arrowhead). (H,H2) In the fins, however, iridophore-independent csf1a expression was present in both wild-type and ltk mutant larvae. (I–J) csf1b expression was at the limit of detection by in situ hybridization. (I,I2) Along the lateral trunk, csf1b transcript (arrowheads) was evident in wild-type larvae, representing either hypodermal cells, iridophores or both, but transcript was not apparent in bnc2 mutant sections stained for equivalent times. (J,J2) Along the dorsal trunk, csf1b transcripts (arrowheads) were evident in both wild-type and bnc2 mutants. Scale bars: in (B) 60 μm for (B); in (C) 100 μm for (C); in (D) 100 μm for (D); in (E) 80 μm for (E,E2,F,F2,G,G2,I,I2), in (H) 80 μm for (H,H2); in (J) 20 μm for (J,J2). |

Localized Csf1 expression directed xanthophore development. (A) Ectopic xanthophores (red dashed line) developed over the dorsal myotome in association with Csf1a-expressing cells transplanted from a wild-type, Tg(hsp70l:csf1a-IRES-nlsCFP) donor to a bnc2 mutant host. Larva shown at 7.9 SSL. (A2) Nuclear CFP expression in the myotome. (A3) Merge. (B) Ectopic xanthophores in a wild-type larva developed over the dorsal myotome in association with a slow muscle fiber of the myotome expressing Csf1a from plasmid smyhc1:TetGBD-TREtightBactinTRX:nlsVenus-V2a-c sf1a.Larva shown at 7.5 SSL. (B2) Nuclear Venus expression. (B3) Merge. (Sample sizes: hsp70l, n = 8; smyhc1, n = 10.) Scale bars: in (A3) 100 μm for (A); in (B) 100 μm for (B). |
Iridophores influenced melanophore pattern in xanthophore-deficient csf1r mutants. (A,B) In stage-matched siblings treated with Mtz, a region on the tail from which iridophores have been ablated (dashed yellow lines in B) exhibits more melanophores than the corresponding region of the control larva (shown here at ~8.5 SSL). Both larvae were treated with epinephrine immediately before imaging. (C,D) Iridophore ablation at the mid-trunk region (dashed yellow lines in D) likewise resulted in increased numbers of melanophores compared to stage-matched control (C)(shown here at ~10.2 SSL). Note that some iridophores have regenerated within previously ablated regions and that melanophores are present at the left edge of the ablated region, adjacent to remaining interstripe iridophores. Larvae in these images were not treated with epinephrine. (E) Quantification of melanophore distributions within dorsal–ventral regions of the flank for larvae that were uninjected but treated with Mtz (left) and for regions of injected, Mtz-treated larvae from which iridophores were unablated (middle) or ablated (right). Plots show means±SE within each region. Asterisk denotes the residual interstripe in csf1r mutants, where melanophore numbers differed significantly between unablated and ablated regions (paired t = 5.6, d.f. = 2, P<0.05). (F,G) Details showing melanophore behaviors in an uninjected control larva (F) and an injected larva (G) in the region of iridophore ablation. Day 0 panels show initial distribution of iridophores and melanophores, prior to Mtz treatment (7.0 SSL). Following iridophore ablation (G), some melanophores moved short distances ventrally (red arrows at d0 and d2 show starting and stopping positions of two melanophores). Melanophores also differentiated within the ablated region (dashed red circles in G, d2); dashed orange circle in G, d7 shows a lightly melanized cell just beneath the surface of the myotome that emerges within the skin by d8. In unablated individuals (F), melanophores typically differentiated further ventrally at sites lacking iridophores (an exception is the left-most melanophore that appeared at d7). Also see Figure S3C. (H) Detail from another individual showing a lightly melanized cell initially near an iridophore that was ablated (blue arrowhead); the melanophore subsequently translocated to settle adjacent to another iridophore. All larvae in F–H were treated with epinephrine. (Total sample size, N = 55.) Scale bars: in (A) 200 μm for (A,C); in (B) 400 μm for (D); in (F, d0) 80 μm for (F,G); in (H, d0) 20 μm for (H). |
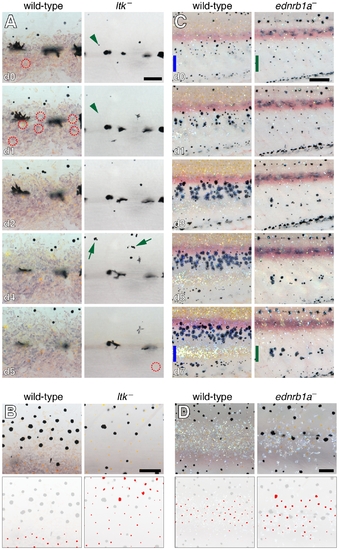
Melanophore and xanthophore development is disrupted in additional iridophore-deficient mutants. (A) Comparison of xanthophore and melanophore development in wild-type and ltk mutants. Shown are details at the horizontal myoseptum from larger images of representative wild-type (ltk/+) and ltk mutant, stage-matched siblings imaged daily (beginning at 6 SSL). In the wild-type, nearly all melanophores persisted through the image series. A xanthophore had already developed at the onset of imaging (day 0, red dashed circle), and additional xanthophores differentiated shortly thereafter. In the ltk mutant, however, melanophores were frequently lost between days (green arrowheads) and melanin-containing debris and extrusion bodies were often apparent (green arrows). Unlike the wild-type, no xanthophores differentiated until day 5 of imaging. (B) During later development (9.6 SSL), xanthophores were confined principally to the interstripe region of the wild-type whereas xanthophore developed widely over the flank in the ltk mutant. The horizontal myoseptum lies at the lower edge of both images. Lower panels show positions of xanthophores in red. (C) Comparison of wild-type and ednrb1a mutant. Shown are ventral flanks of representative stage-matched, sibling wild-type (ednrb1a/+) and ednrb1a mutant larvae imaged daily (8.8–10 SSL). At the onset of imaging, wild-type melanophores are largely absent from a region where the second interstripe will form by day 7 of imaging (blue bars). In ednrb1a mutants, however, melanophores are relatively uniformly distributed in this region at the onset of imaging, and, by day 7 of imaging, formed clusters where the second interstripe would normally form (green bars). Images shown were rescaled to control for growth. (D) Closeups showing reduced iridophores in ednrb1a mutant compared to wild-type (9.0 SSL) as well as wider distribution of xanthophores. Fish in A, B and D were treated briefly with epinephrine prior to imaging. Sample sizes for which complete image series were obtained were: ltk, n = 6; ltk/+, n = 5; ednrb1a, n = 4; ednrb1a/+, n = 5. Scale bars: in (A, d0) 60 μm for (A); in (B) 100 μm for (B); in (C, d0) 200 μm for (C, d0); in (D) 100 μm for (D). |
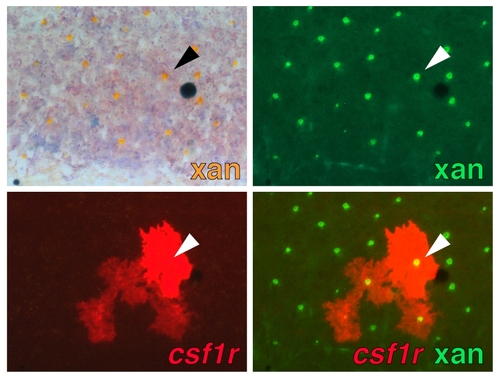
Expression of csf1r reporter by xanthophores during the larval-to-adult transformation. Interstripe xanthophores autofluoresce in the same channel as GFP and coexpress an mCherry csf1r reporter (arrowhead). Individual shown is Tg(csf1r:Gal4.VP16)i186 injected with a plasmid containing 4xUAS-mCherry, resulting in mosaic mCherry expression. |

Pigment cell distributions in csf1r mutants. (A) Despite the absence of well-differentiated xanthophores over the flank, csf1r mutants often exhibited a few lightly pigmented xanthophores at the level of the horizontal myoseptum and lateral line nerve (dashed blue line). (A2) Higher magnification view of boxed region in A. (B) In an individual in which iridophores have been ablated and partially recovered, residual xanthophores remained confined to the horizontal myoseptum and did not enter the region from which iridophores had been lost (likely owing to csf1r requirements for xanthophore migration [22], [54]). Shown here is the same region of the larva shown in main text Figure 8G (d8), with higher magnification view of boxed region and residual xanthophores in B2. (C) Image showing distributions of iridophores and melanophores along the ventral trunk of an unmanipulated csf1r mutant (10.4 SSL). Most melanophores are centered in regions lacking iridophores. (C2) Schematic showing distribution of iridophores (blue) and melanophores (black). Larvae in A and B were treated with epinephrine immediately before imaging (not all melanosomes have contracted in A). Scale bars: in (B) 60 μm for (A and B); in (C) 400 μm for (C,C2). |