
- Title
-
Zebrabow: multispectral cell labeling for cell tracing and lineage analysis in zebrafish
- Authors
- Pan, Y.A., Freundlich, T., Weissman, T.A., Schoppik, D., Wang, X.C., Zimmerman, S., Ciruna, B., Sanes, J.R., Lichtman, J.W., and Schier, A.F.
- Source
- Full text @ Development

Ubiquitous and persistent Zebrabow expression with ubi:Zebrabow transgenic fish. (A) Top, diagram of the ubi:Zebrabow construct; bottom, schematic of ubi:Zebrabow expression. Small black circles indicate cells in the entire animal, and the large blue circle indicates an organ of interest. Recombination can be induced either broadly or in a tissue-specific manner. (B-D) Confocal images of ubi:Zebrabow-S transgenic at 2 dpf. In the default state, RFP is expressed (B). With Cre protein injection, three colors are observed in heterozygotes (red, green, blue) (C) and increased color diversity is detected in homozygotes (D). (E,F) Combinatorial Zebrabow expression in ubi:Zebrabow-M transgenic injected with Cre. (E) Confocal section of the eye of a 2 dpf embryo. (F) Juvenile fish (30 dpf) viewed under bright-field illumination (top) or fluorescent illumination (bottom). (G) Heart-specific recombination in cmlc2:CreER;ubi:Zebrabow-M larvae. (H) Diencephalon-specific recombination in pax2a:CreER19;ubi:Zebrabow-M larvae. MB, midbrain; HB, hindbrain; TG, trigeminal ganglion. Scale bars: 100 μm in B-E,G,H; 5 mm in F. |

Gal4 inducible expression with UAS:Zebrabow transgenic fish. (A) Top, diagram of the UAS:Zebrabow constructs; bottom, schematic of UAS:Zebrabow expression. (B-D) Trigeminal sensory neurons labeled with UAS:Zebrabow-V and a somatosensory neuron-specific Gal4 driver, s1102t. In the absence of Cre, only RFP is expressed (B). When Cre is provided, six colors are observed in heterozygotes (C) and more than ten colors are observed in the progeny of crosses between heterozygous parents (D). (E,F) Using the s1020t Gal4 line, spinal cord labeling in line V is sparse (E), whereas labeling in line B is significantly broader (F). (G,H) Broad labeling can be achieved by co-injecting Gal4 mRNA and Cre protein. Expression is strong from embryonic stage (G, 24 hpf) to larval stage (H, 3 dpf). Scale bars: 50 μm. |

Axon labeling and tracing. The s1102t;UAS:Zebrabow-V transgenic line labels somatosensory neurons and their axons. (A,B) Central axons in the hindbrain at 5 dpf, viewed dorsally. Axonal varicosities (presynaptic terminals) are visible in individual axons (B, arrowheads). (C-F) Somatosensory neuron cell bodies are located in the trigeminal ganglion (C, arrowhead). Each neuron forms an axonal arbor that branches extensively in the skin. Four neurons (numbered) were traced and are shown in E. The same image in the absence of color information is more difficult to trace (D). Axonal morphology was imaged every 2 hours from 28 to 44 hpf. Two time points are shown (E,F). Scale bars: 100 μm in A,C-F; 25 μm in B. |
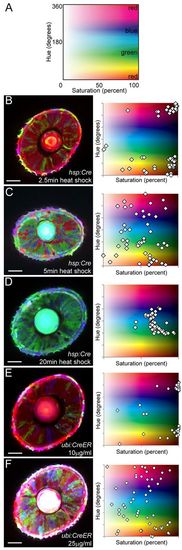
Optimization of color diversity. (A) Hue-Saturation plot, with colors displayed according to their color profile. Pure colors (red, green, blue) are highlighted. 0° hue is equivalent to 360° hue. (B-F) Confocal images of the eye of a ubi:Zebrabow-M transgenic larva under different Cre activity levels. Cre was induced by heat shock (B-D) or by addition of tamoxifen (E,F). Heat-shock duration and tamoxifen concentration are as indicated. Each data point represents the color profile of a single cell within one optical section. Scale bars: 50 μm. |

Inheritance and stability of color. (A) Experimental procedure for time-lapse imaging. (B-D) A Ubi:Zebrabow-M;ubi:CreER transgenic animal imaged from 2 to 10 dpf. Images are shown at the same scale at each developmental stage. Yellow boxed regions are shown at higher magnification in the bottom panels. (E,F) Color profiles for individual cells are plotted. At 2 dpf, single-color cell clusters are plotted on the Hue-Saturation graph (E). The orange cluster shown in B-D (asterisks) is circled. We re-identified individual clusters at 5 and 10 dpf, and plotted all of the cells from all clusters from all time points (2, 5 and 10 dpf) (F). The orange cluster showed highly similar color profiles at all time points, as do most other clusters. One exception is a cyan cluster (asterisk), which showed an increase in saturation from 2 dpf to 5 dpf. (G) Analysis of cluster size (number of cells within a cluster) at different time points. Cluster size increases between 5-6 dpf and 10 dpf (***P<0.001) and decreases thereafter (*P<0.05). Significance calculated by one-way analysis of variance with Bonferroni post hoc test. Sample size: 2 dpf, n=33; 5-6 dpf, n=86; 10 dpf, n=86; 15 dpf, n=48. Scale bars: 50 μm. |
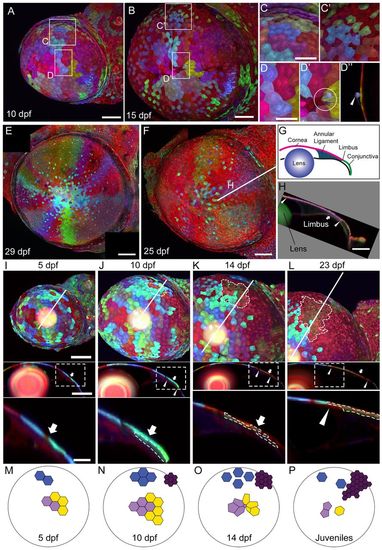
Long-term clonal analyses in the cornea. (A,B) Corneal clones at 10 and 15 dpf. (C,C2) Peripheral cornea clones become scattered and interspersed by smaller cells. (D-D′′) Rosette-like structures are seen in the central cornea (compare D with D′, circle marks a rosette). In optical cross-section at the center of the rosette (D2), a cell that has been extruded from the corneal surface can be seen (arrowhead). (E,F) Two examples of wedge-shaped clones in juvenile stage fish. (G) The anterior segment of the eye, shown in cross-section. The limbus marks the boundary of the cornea (pink) and the conjunctiva (green). (H) Optical cross-section at the plane indicated by the white line in F. Arrowheads indicate the peripheral and central boundaries of the clone. Arrow marks the limbus. (I-L) Top panels show lateral view of the cornea, with an olive-colored, late-born clone outlined (clone is not found at 5 dpf). Part of the olive-colored clone is underneath cyan-colored cells, which become more dispersed over time. Middle panels show optical cross-sections at the plane indicated by the white line in the top panels. Bottom panels show the region outlined in the box in the middle panels. The olive-colored clone is outlined. Arrows indicate the limbus; arrowheads mark the peripheral and central boundaries of the clone. (M-P) Model of clone development in the corneal epithelium. Large circle indicates the cornea and small polygons indicate cells. (M) At 5 dpf, clones are small and cohesive. (N) At 10 dpf, cells proliferate and remain cohesive. Small clones at the limbus region are formed (dark purple cluster). (O) At 14 dpf, early formed clones are scattered in the peripheral cornea (blue cluster) and form rosettes in the central cornea (light purple and yellow clusters). Cells in the late-formed purple cluster proliferate and migrate towards the center. (P) Early-formed clusters are further dispersed. Late-formed clusters begin to form wedge-shape structures. Scale bars: 100 μm in A,B; 50 μm in C,D; 200 μm in E,F,H; in I-L, 100 μm in the top and middle panels, and 25 μm in the bottom panels. |
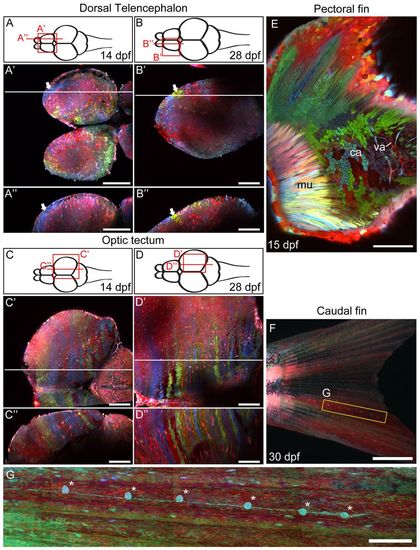
Zebrabow labeling in different organ systems. (A-D′) Two-photon image of the dorsal telencephalon and optic tectum at late larval stage (14 dpf, A-A′ and C-C′) and juvenile stage (28 dpf, B-B′ and D-D′). A-D show diagrams of the zebrafish brain, viewed dorsally. A2-D2 show horizontal optical sections of the areas highlighted in the diagrams above. A′-D′ show sagittal optical sections along the horizontal lines in the middle panel. Clusters of single-colored cells are seen at different regions of the dorsal telencephalon (white arrows). (E) The pectoral fin of a 15 dpf animal, viewed from the side. Muscle (mu), cartilage (ca) and vasculature (va) can be seen in this view. (F,G) In the caudal fin, an array of lateral line organs (asterisks) extend from the base of the tail to the edge of the caudal fin (G). Scale bars: 100 μm in A-E; 1 mm in F; 250 μm in G. |

Generation of Zebrabow transgenesis construct and analysis of transgenic expression in adult animals. (A) Diagram of the Zebrabow-GateDest cloning vector for inserting promoters upstream of Zebrabow. Promoters are first inserted between AttL sites to make an Entry vector. The Entry vector is then mixed with Zebrabow-GateDest and LR Clonase II to generate the final recombined vector. (B,C) Tissue sections of ubi:Zebrabow-S (B) and a wild-type adult fish (C) at the level of the spinal cord. RFP fluorescence is shown in red and Nissl counterstain is shown in cyan. (D,E) Brain sections from adult ubi:Zebrabow-M;ubi:CreER animal, with Cre induced at embryonic stage (10-12 hpf). Coronal section of the tectum (D) and sagittal section of the forebrain (E) are shown. Scale bars: 200 μm in B-D; 100 μm in E. |

Trigeminal sensory ganglion shown in Fig. 3D was tested for color constancy. (A-E) For five differently colored cells, hue and saturation values of their cell bodies (asterisk) in different z-planes and at different points along axons (arrowheads) were measured and plotted. Values are averaged from a 5×5 pixel square of a single optical section. |

Time-lapse imaging of clonal growth in the cornea. (A-C) Cornea clones imaged at 10 (A), 14 (B) and 30 (C) dpf. All images are montages of maximal intensity projections, shown at the same scale. One blue clone (blue outline) and one green clone (green outline) were traced. Both clones showed substantial centripetal growth. (D) Hue and saturation values of cells in the blue or green clone at 30 dpf are plotted. Measurements were made from 5×5 pixel areas from individual optical sections. Cells within a cohesive clone are consistent in their color profiles. |