FIGURE SUMMARY
Title

The BH3-Only SNARE BNip1 Mediates Photoreceptor Apoptosis in Response to Vesicular Fusion Defects

Authors
Nishiwaki, Y., Yoshizawa, A., Kojima, Y., Oguri, E., Nakamura, S., Suzuki, S., Yuasa-Kawada, J., Kinoshita-Kawada, M., Mochizuki, T., and Masai, I.
Source
Full text @ Dev. Cell

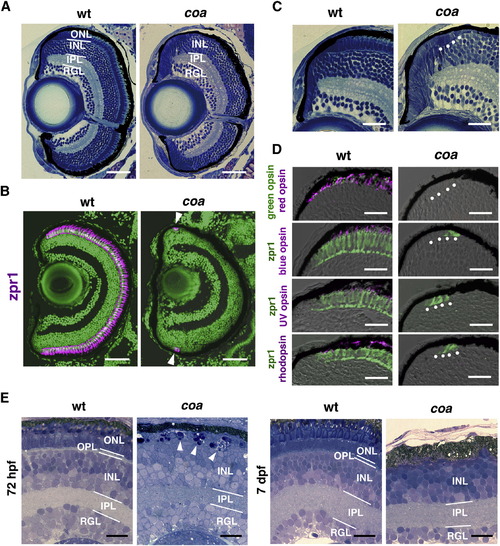
Photoreceptors Undergo Apoptosis in the Zebrafish coa Mutant (A) Plastic sections of WT and coa mutant retinas at 6 dpf. ONL is absent in the coa mutant. (B) Zpr1 antibody labeling of 6 dpf WT and coa mutant retinas. All nuclei are counterstained with SYTOX Green (green). Arrowheads indicate zpr1 expression (magenta) in the CMZ of the coa mutant. (C) Plastic sections of CMZ of 6 dpf WT and coa mutant retinas. White dots indicate morphologically distinct ONL in the coa mutant. (D) Labeling of 6 dpf WT and coa mutant retinas with anti-red, blue, UV opsins, or rhodopsin antibodies (magenta); anti-green opsin antibody (green); and zpr1 (green) antibody. (E) Semithin sections of WT and coa mutant retinas at 72 hpf and 7 dpf. At 72 hpf, pyknotic nuclei were observed in the ONL in the coa mutant (arrowheads). At 7 dpf, ONL was absent in the coa mutant. INL, inner nuclear layer; IPL, inner plexiform layer; OPL, outer plexiform layer; RGL, retinal ganglion cell layer. Scale bars, 50 μm (A and B) and 20 μm (C–E). See also Figure S1.

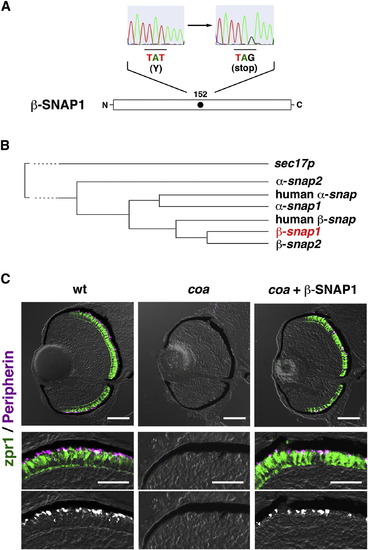
The coa Mutant Gene Encodes β-SNAP1(A) A non-sense mutation occurs at 152Y in β-snap1 gene in the coa mutant.(B) There are four zebrafish snap genes: two α-snap and two β-snap genes. β-SNAP1 has 90.8% amino acid identity to β-SNAP2, whereas β-SNAP1 has 78% and 73% amino acid identity to α-SNAP1 and α-SNAP2, respectively. In accordance with the evolution tree, zebrafish α-snap2 gene is positioned outside the human α-snap gene. Zebrafish β-snap genes seem to be duplicated after separation from human β-snap gene. sec17p is a yeast α-SNAP homologous gene. (C) Labeling of 84 hpf WT, coa mutant retinas, and coa mutant retinas expressing β-SNAP1 with zpr1 antibody (green) and GFP-tagged peripherin (magenta). Middle panels show higher magnification of the outer photoreceptor layer. Lower panels show the magenta channel. Scale bars, 50 μm (upper panels) and 10 μm (middle panels). See also Figure S2.

EXPRESSION / LABELING:
Antibody:
Fish:
Anatomical Term:
Stage: Protruding-mouth

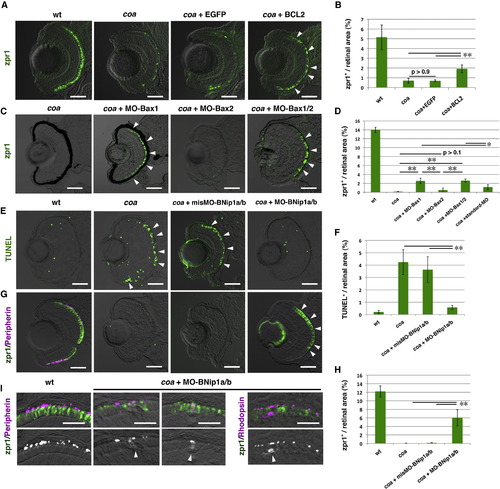
Photoreceptor Degeneration in the coa Mutant Depends on BNip1 (A) Zpr1 labeling (green) of 84 hpf WT, coa mutants, coa mutants injected with egfp mRNA, and bcl2 mRNA. Arrowheads indicate rescued photoreceptors. (B) Percentage of zpr1-positive areas relative to the total retinal area in the experiments shown in (A). Green and black bars indicate the mean and SD, respectively. **p < 0.01. (C) Zpr1 labeling (green) of 84 hpf coa mutant and coa mutants injected with MO-Bax1, MO-Bax2, or a mixture of MO-Bax1 and MO-Bax2. Arrowheads indicate rescued photoreceptors. (D) Percentage of zpr1-positive areas relative to the total retinal area in the experiments shown in (C) as well as in a coa mutant injected with the standard MO. Green and black bars indicate the mean and SD, respectively. **p < 0.01 and *p < 0.05. (E) TUNEL staining (green) of 84 hpf WT, coa mutant, coa mutant retinas injected with misMO-BNip1a/b, and a mixture of MO-BNip1a and MO-BNip1b. Arrowheads indicate apoptosis in the ONL. (F) Percentage of TUNEL-positive areas relative to the total retinal area in the experiments shown in (E). Green and black bars indicate the mean and SD, respectively. **p < 0.01. (G) Zpr1 labeling (green) and GFP-tagged peripherin (magenta) in 84 hpf WT, coa mutant, coa mutant retinas injected with misMO-BNip1a/b or a mixture of MO-BNip1a and MO-BNip1b. Arrowheads indicate rescued photoreceptors. Nonspecific zpr1 signal was observed in the lens. (H) Percentage of zpr1-positive areas relative to the total retinal area in the experiments shown in (G). Green and black bars indicate the mean and SD, respectively. **p < 0.01. (I) Zpr1 labeling (green) and GFP-tagged peripherin or rhodopsin (magenta) in the photoreceptor cell layer in WT and coa mutants injected with MO-BNip1a and MO-BNip1b. Lower panels show the magenta channel. Arrowheads indicate the failure of transport to the OS.The numbers of retinal sections used in the experiments shown in (B), (D), (F), and (H) and p values for the t test are shown in Table S2. Scale bars, 50 μm (A, C, E, and G) and 10 μm (I). See also Figures S3 and S4.

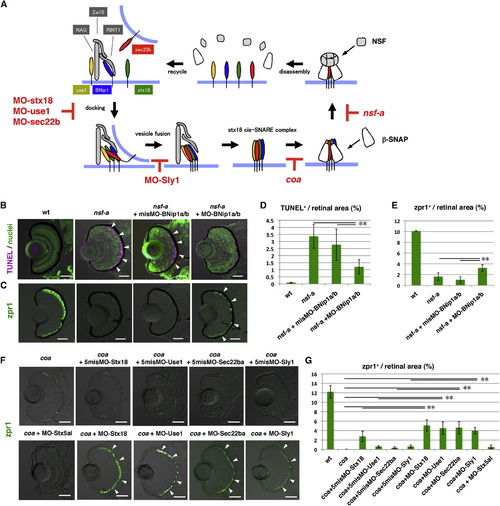
The Syntaxin-18 cis-SNARE Complex Is Required for BNip1-Dependent Apoptosis(A) Molecular mechanism underlying vesicular fusion to the ER. Interactions among syntaxin-18 (green), BNip1 (blue), Use1 (yellow), and Sec22b (red) initiate the fusion of transport vesicles to the ER membrane. Three accessory proteins, Zw10, NAG, and RINT1, play a role in the tethering of transport vesicles. After membrane fusion occurs, β-SNAP binds to the cis-SNARE complex and recruits NSF. NSF promotes disassembly of the cis-SNARE complex. In the absence of β-SNAP or NSF activity, the syntaxin-18 cis-SNARE complex accumulates. MOs against syntaxin-18, Use1, Sec22b, and Sly1 inhibit the formation of the syntaxin-18 cis-SNARE complex, even in the absence of β-SNAP or NSF activity. (B) TUNEL staining (magenta) of 72 hpf WT, nsf-a mutant, and nsf-a mutant retinas injected with misMO-BNip1a/b, and a mixture of MO-BNip1a and MO-BNip1b. Nuclei were counterstained with SYTOX Green (green). Arrowheads indicate apoptosis in the ONL. (C) Zpr1 labeling (green) of 84 hpf WT, nsf-a mutant, nsf-a mutant retinas injected with misMO-BNip1a/b, and a mixture of MO-BNip1a and MO-BNip1b. Arrowheads indicate rescued photoreceptors. (D and E) Percentage of TUNEL-positive (D) and zpr1-positive areas (E) relative to the total retinal area in the experiments shown in (B) and (C), respectively. Green and black bars indicate the means and SDs, respectively. **p < 0.01. (F) Zpr1 labeling (green) of coa mutant and coa mutants injected with MO-syntaxin-18, MO-Use1, MO-Sec22ba, MO-Sly1, their 5misMOs, and MO-syntaxin 5al. Arrowheads indicate rescued photoreceptors. (G) Percentage of zpr1-positive area relative to the total retinal area in the experiments shown in (F). Green and black bars indicate the means and SDs, respectively (**p < 0.01). The numbers of retinal sections used in the experiments shown in (D), (E), and (G) and p values for the t test are shown in Table S2. Scale bars, 50 μm. See also Figure S5.

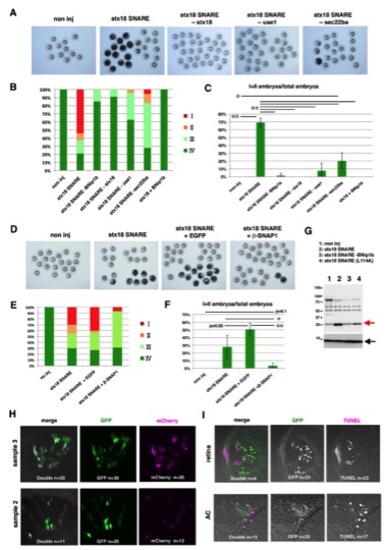
Concurrent Expression of Syntaxin-18 SNARE Components Induces Bax-Dependent Apoptosis in a BNip1-BH3 Domain-Dependent Manner(A) Antiactivated caspase 3 antibody labeling of 7 hpf embryos injected with different RNA combinations of syntaxin-18 SNARE components: noninjection, syntaxin-18 SNARE mixture, syntaxin-18 SNARE mixture lacking BNip1b, syntaxin-18 SNARE mixture replaced with BNip1b (L114A), and syntaxin-18 SNARE mixture plus a mixture of MO-Bax1 and MO-Bax2. Cells with active caspase 3 were increased only in embryos injected with a mixture of mRNAs for all four syntaxin-18 SNARE components. (B) Top panels indicate 8 hpf embryos injected with the same RNA combinations shown in (A). The bottom panel shows a classification of the morphological defects of 8-hpf-injected embryos as embryonic cell death (class I), blown-up blastoderm during gastrulation (class II), nonuniform thickness of the blastoderm (class III), and normal morphology (class IV). (C) Percentages of 8 hpf embryos classified as classes I–IV in the injection experiments shown in (B) as well as the injection experiments for the syntaxin-18 SNARE mixture plus either MO-Bax1 or MO-Bax2. (D) Percentage of class I/II embryos. Green and black bars indicate the mean and SD, respectively. The numbers of injection experiments and t test p values are shown in Table S2 . *p < 0.05, **p < 0.01. (E) TUNEL staining of WT embryos expressing a mixture of all syntaxin-18 SNARE components and EGFP or only EGFP under the control of the atoh7 retinal enhancer. In embryos expressing a mixture of all syntaxin-18 SNARE components and EGFP, TUNEL-positive cells (magenta) are observed in the GFP-positive (green) retinal region, especially retinal ganglion cells (RGC; arrowheads), and anterior commissural (AC, arrowheads) and olfactory (olf, arrow) neurons. (F) The density of apoptotic cells (number/100 μm2) in retinas injected with DNA constructs encoding a mixture of syntaxin-18 SNARE components and EGFP or only EGFP. The number of examined retinas was n = 4 for each. Green and black bars indicate the mean and SD; **p < 0.01. Scale bars, 200 μm (A), 600 μm (B), and 50 μm (E). See also Figure S6.

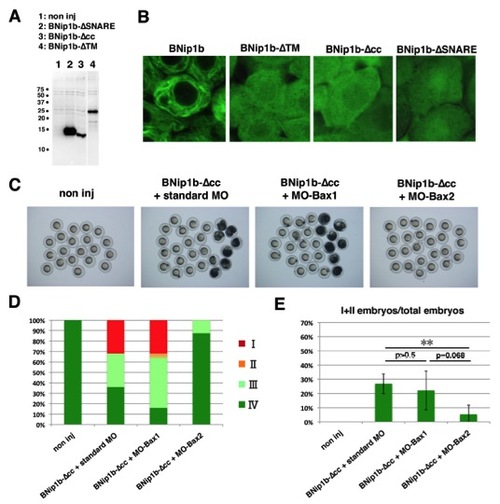
The N-Terminal Coiled-Coil Domain Suppresses BNip1 Proapoptotic Activity(A) BNip1b has four distinct domains: a coiled-coil domain, a BH3 domain, a SNARE domain, and a TM domain. Configuration of deletion constructs (BNip1b-ΔTM, BNip1b-ΔSNARE, BNip1b-Δcc, BNip1b-Δcc-BH3(L114A), and BNip1b-Δcc-ΔBH3). (B) Activation of caspase 3 at 7 hpf (upper rows) and morphologies at 8 hpf (lower rows) in embryos injected with mRNA encoding BNip1b, BNip1b-ΔTM, BNip1b-ΔSNARE, BNip1b-Δcc, and BNip1b-Δcc-ΔBH3. Severe embryonic death and morphological defects are observed only in BNip1Δcc-expressing embryos. (C) Percentages of 8 hpf embryos classified as classes I–IV in the injection experiments shown in (B) (lower panels), as well as BNip1b-Δcc-BH3(L114A). (D) Percentage of class I/II embryos. Green and black bars indicate the means and SDs, respectively. The numbers of injection experiments and t test p values are shown in Table S2. **p < 0.01. Scale bars, 200 μm (B, upper panels) and 600 μm (B, lower panels). See also Figure S7.

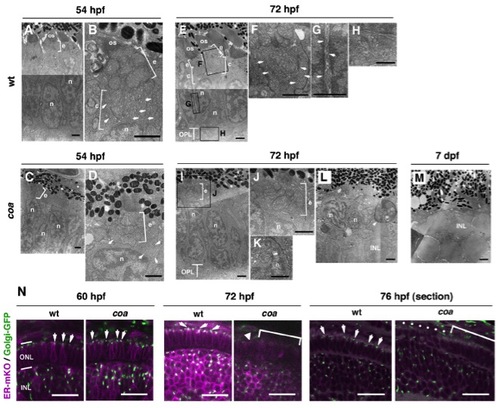
Amounts of OS and intracellular cisternae are reduced in coa mutant photoreceptors, related to Figure 1
(A, B) EM images of wild-type photoreceptors at 54 hpf. The OS starts to form. A mitochondria-rich region, which is called the ellipsoid (e), develops beneath the OS. Tubular cisternae (c) (B, arrows) are observed between the ellipsoid region (e) and nucleus (n). (C, D) EM images of coa mutant photoreceptors at 54 hpf. Ellipsoid region (e) and nuclei (n) are observed but the OS is absent or very small. Tubular cisternae are not well developed and small cisternae-like structures are observed near the nucleus (D, arrows). (E–H) EM images of wild-type photoreceptors at 72 hpf. The panels (F–H) indicate higher magnification. The OS becomes enlarged, and ellipsoid, tubular cisternae (F, arrows), nuclei and synapse ribbons (H) are observed. Tubular structures surrounding the nucleus, which possibly correspond to the ER, are observed (G, arrows). (I–L) EM images of coa mutant photoreceptors at 72 hpf. Panels (J, K) indicate higher magnification. Ellipsoid (e) and nucleus (n) are evident, but tubular cisternae structures are reduced between the ellipsoid and nucleus (J). Occasionally, mitochondria are associated with the nucleus (K, arrow). Some abnormal shaped nuclei and a phagosome-like structure containing mitochondria (arrowhead, L) are observed. (M) EM images of coa mutant photoreceptors at 7 dpf. The outer nuclear layer (ONL) is completely eliminated. The INL nuclei are associated with pigmented epithelium. (N) Confocal scanning of whole-mount (60 and 72 hpf) and sectioned (76 hpf) retinas of wild-type and coa mutant embryos injected with ER-mKO (magenta) and Golgi-GFP (green) mRNAs. ER-mKO and Golgi-GFP (arrows) are localized in the perinuclear region and the apical region of wild-type photoreceptors, respectively. In coa mutant photoreceptors, expression of both proteins is normal at 60 hpf, but Golgi-GFP signals are faint at 72 hpf (arrowhead) and subsequently disappear (bracket). A dotted line indicates degenerating photoreceptors in the coa mutant at 76 hpf. Abbreviations: c, tubular cisternae; e, ellipsoid; INL, inner plexiform layer; n, nucleus; OPL, outer plexiform layer; OS, outer segment. Scale bars: 1 μm (A–M), 10 μm (N).

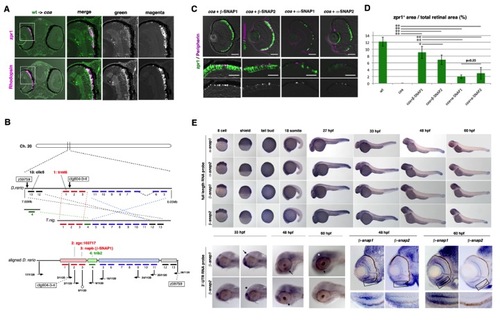
Cloning of the coa mutant gene, related to Figure 2
(A) Cell transplantation of wild-type donor cells into the coa mutant recipient retina. When wild-type cells labeled with biotin-dextran (green) were incorporated into the coa mutant retina, wild-type cells survived to express zpr1 (magenta, upper panels) and rhodopsin (magenta, lower panels) at 6 dpf. (B) The coa mutation is flanked by two polymorphic markers, ctg604-3-4 and z59759, on chromosome 20. These two markers are located close to the trmt6 and clic5 genes, respectively. On the Tetraodon nigroviridis genome, eleven genes are aligned between the trmt6 and clic5 genes (intermediate bar, T. nig.). On the other hand, 13 genes, including the trmt6 and clic5 genes, are shuffled in a different order on the zebrafish genome annotated in Ensemble Zv7 (version 50.7d) (top bar, D. rerio). We corrected the alignment of these genes on the zebrafish genome in accordance with the recombination rate of polymorphic markers (bottom bar, aligned D. rerio). As a result, the coa mutation mapped to the region between zgc:103717 and trib2, where β-snap1 is located. (C) Labeling of 84 hpf coa mutant retinas injected with DNA encoding heat-shock promoter-fused β-SNAP1, β-SNAP2, α-SNAP1 and α-SNAP2 with zpr1 antibody (green) and GFP-tagged peripherin or anti-rhodopsin antibody (magenta). GFP-tagged peripherin was normally localized in coa mutant photoreceptors expressing β-SNAP1. Similar to the case of β-SNAP1, photoreceptors were maintained and rhodopsin was normally localized in coa mutant photoreceptors expressing β-SNAP2. The maintenance of photoreceptors was partially rescued and some dotted signals for peripherin were observed in coa mutant photoreceptors expressing α-SNAP1 or α-SNAP2. Middle panels indicate higher magnification of the outer photoreceptor layer shown in upper panels. Lower panels show the magenta channel. GFP-tagged peripherin or rhodopsin (magenta) is transported to the apical region of photoreceptors in all cases. (D) The percentage of zpr1-positive region relative to the total retinal region. Green and black bars indicate the means and standard deviations, respectively. The percentage is 12% in wild type and nearly zero in the coa mutant. Photoreceptors are effectively rescued in coa mutant embryos expressing β-SNAP1 and β-SNAP2. Although photoreceptors are rescued in coa mutant embryos expressing α-SNAP1 and α-SNAP2, the percentages are lower than those in embryos expressing β-SNAP1 and β-SNAP2. Numbers of retinal sections used and p-values of t-tests are shown in Table S2. *p<0.05, **p<0.01. (E) Expression of α-snap1, α-snap2, β-snap1 and β-snap2 mRNA during development. Upper and lower panels indicate in situ hybridization using full-length and 3′-UTR RNA probes, respectively. All four mRNAs are expressed ubiquitously from eight cells to tail bud stage, and later restricted in the brain, especially the eye and tectum. At 33 hpf, β-snap1 mRNA is expressed in the telencephalon and pineal eye (arrow), whereas β-snap2 mRNA is not expressed in the pineal eye (asterisk). At 48 hpf, β-snap1 mRNA is expressed in the retina (arrows), whereas β-snap2 mRNA expression is not detected in the retina (asterisk). At 60 hpf, β-snap1 mRNA is expressed in the retina (arrow) and tectum (asterisk), whereas β-snap2 mRNA is very weak in both tissues. Sections of 48 and 60 hpf retinas labeled with β-snap1 and β-snap2 RNA probes show that β-snap1 mRNA is expressed in the retina, especially strong near the CMZ, but that β-snap2 mRNA expression is very weak in the retina. A higher magnification of the photoreceptor cell layer in the ventral retina is indicated. Scale bars: 50 μm (C, upper panels), 10 μm (C, middle panels)

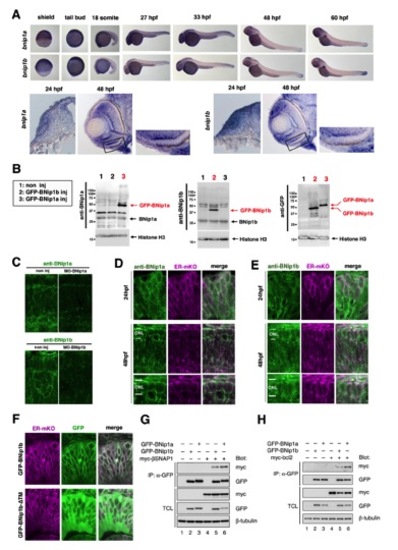
Expression of zebrafish BNip1 mRNA, subcellular localization of zebrafish BNip1 protein, and the in vitro interaction between zebrafish BNip1, !-SNAP and Bcl2 proteins, related to Figure 3
(A) Expression of mRNAs for BNip1a and BNip1b in whole-mount embryos (upper panels). Both mRNAs are expressed ubiquitously at the shield and tail bud stages, and prominently expressed in the head including the retina after 24 hpf. The lower panels indicate retinal sections at 24 and 48 hpf. A higher magnification of photoreceptor cell layer in the ventral retina is indicated. (B) Western blotting of zebrafish 7 hpf non-injection embryos, embryos injected with mRNA of GFP-tagged BNip1a and GFP-tagged BNip1b using anti-BNip1a, anti-BNip1b, and anti-GFP antibodies. Black and red arrows indicate bands corresponding to BNip1a/BNip1b (26 kDa) and GFP-tagged BNip1a/BNip1b, respectively. Anti-BNip1a and anti-BNip1b antibodies specifically detect GFP-tagged BNip1a and BNip1b, respectively. Anti-GFP antibody detected both GFP-tagged BNip1a and GFP-tagged BNip1b. Histone H3 is a loading control detected on the same membrane. (C) Labeling of 48 hpf wild-type and bnip1a and bnipb morphant retinas with anti-BNip1a and anti-BNip1b antibodies, respectively. Antibody signals disappear in the morphants, confirming the specificity of anti-BNip1 antibodies for immunohistochemistry. (D–E) Labeling of 24 and 48 hpf wild-type retinas with anti-BNip1a (D) and anti-BNip1b (E) antibodies (green). ER-mKO (magenta) was used to visualize the ER. The ER is localized in the peri-nuclear region. BNip1a and BNip1b expression patterns overlapped with that of ER-mKO, although the expression pattern of BNip1b is broader than that of BNip1a. Both proteins are detected in the ONL at 48 hpf. (F) Confocal scanning of 24 hpf wild-type retinas expressing ER-mKO as well as GFP-tagged BNip1b (top panels) and GFP-tagged BNip1b-!TM (bottom panels), the latter of which lacks the transmembrane domain (TM). GFP-tagged BNip1b (green) is localized to mesh-like subcellular structures surrounding the nucleus and its distribution overlaps with that of ER-mKO (magenta), suggesting that GFP-tagged BNip1b is enriched in the ER. Conversely, GFP-tagged BNip1b-ΔTM does not overlap with ER-mKO, but rather, is uniformly located outside the nucleus, suggesting that TM is required for ER-localization of BNip1. (G, H) Interaction between zebrafish β-SNAP1 and zebrafish BNip1 proteins (G), and between zebrafish Bcl2 and zebrafish BNip1 proteins (H). Detection of these interactions in HEK293 cells by co-immunoprecipitation. IP: antibody used for immunoprecipitation; Blot: antibodies used for western blotting. TCL: total cell lysates.

EXPRESSION / LABELING:
Genes:
Fish:
Anatomical Terms:
Stage Range: Shield to Pec-fin

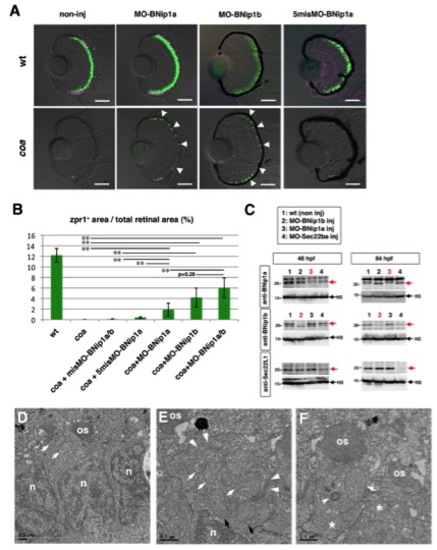
MO-BNip1 rescues photoreceptors but not defects in OS and intracellular cisternae formation, related to Figure 3
(A) Zpr1 (green) and anti-rhodopsin (magenta) antibody labeling of 84 hpf wild-type and coa mutant retinas injected with MO-BNip1a, MO-BNip1b and 5mis-MO-BNip1a. Zpr1-positive photoreceptors are partially rescued in coa mutant retinas injected with MO-BNip1a and MO-BNip1b (arrowheads). (B) The percentage of zpr1-positive area relative to the total retinal area. Green and black bars indicate the means and standard deviations, respectively. Numbers of retinal sections used and p-values of t-tests are shown in Table S2. **p<0.01. (C) Western blotting of the heads of zebrafish 48 and 84 hpf non-injection embryos, and embryos injected with MO-BNip1a, MO-BNip1b and MO-sec22ba using anti-BNip1a, anti-BNip1b and anti-sec22L1 antibodies. Bands corresponding to BNip1a, BNip1b and Sec22ba were specifically reduced in bnip1a, bnip1b and sec22ba morphants, respectively (red arrow). Histone H3 is a loading control detected on the same membrane. (D–F) EM images of coa mutant photoreceptors injected with both MO-BNip1a and MO-BNip1b at 84 hpf. (E, F) Higher magnification. The OS is still small. The mitochondria (arrows, D–F) accumulated but tubular cisternae were reduced and abnormally positioned between the OS and the nucleus (n) (arrowheads, E). Some mitochondria were abnormally located near the nucleus (black arrows, E). Excessive accumulation of vesicle-like structures was observed (asterisks, F). The arrowhead indicates a connecting cilium (F). Abbreviations: n, nucleus; OS, outer segment. Scale bars: 50 μm (B), 0.5 μm (D–F).

Injection experiments of a mixture of mRNAs and DNA constructs for syntaxin 18 SNARE components, related to Figure 5
(A) Eight hpf embryos injected with different combinations of mRNAs for syntaxin 18 SNARE components at 50 μg/mL each: non-injection, syntaxin 18 SNARE mixture, and syntaxin 18 SNARE mixture lacking either syntaxin 18, use1, or sec22ba. (B) Histogram of the percentage of 8 hpf embryos classified as class I-IV in the injection experiments shown in (A) and of a mixture of syntaxin 18 and bnip1b mRNAs. (C) Percentage of class I/II embryos. Green and black bars indicate the mean and standard deviation, respectively. *p<0.05. **p<0.01. (D) Eight hpf embryos injected with different combinations of mRNAs for syntaxin 18 SNARE components at 50 μg/mL each, EGFP at 200 µg/mL and β-SNAP1 at 200 μg/mL. (E) Histogram of the percentage of 8 hpf embryos classified as class I–IV in the injection experiments shown in (D). (F) Percentage of class I/II embryos. Green and black bars indicate the mean and standard deviation, respectively. *p<0.05. **p<0.01. The number of injection experiments shown in (C, F) and p-values from t-tests are shown in Table S2. (G) Western blotting of 7 hpf embryos injected with different combination of mRNAs for syntaxin 18 SNARE components using anti-BNip1b antibody. Stable protein expression of BNip1b (red arrow, lane 2) and BNip1b(L114A) (red arrow, lane 4) was confirmed. Histone H3 is a loading control detected on the same membrane (black arrow). (H) Confocal scanning of 48 hpf wild-type retinas injected with DNA constructs encoding atoh7:GFP (15 μg/mL) and atoh7:mCherry-BNip1a (2.5 μg/mL). In the upper case (sample 3 used in Table S3A), almost all cell express both GFP and mCherry-BNip1a. The percentage of the number of double-positive cells relative to the total number of GFP-expressing cells is 100 %. In the lower case (sample 2 used in Table S3A), the percentage the number of double-positive cells relative to the total number of GFP-expressing cells is 55%. These percentages were used for the estimation of the probability of co-expression of GFP and one of SNARE components (Pi). (I) High magnification images of Figure 5E. Upper and lower panels indicate RGCs at 72 hpf and ACs at 48 hpf, respectively. The percentage of concurrent expression of all four syntaxin 18 SNAREs in GFP-positive cells (Pc) is estimated as TUNEL-positive cell number/(TUNEL-positive cell number + GFP-positive cell number - double-positive cell number). As shown in Table S3B, Pc was 54.8 % for RGCs and 45.9 % for ACs.

Injection experiments of a mixture of mRNAs for BNip1 deletion mutants, related to Figure 6
(A) Western blotting of 7 hpf embryos injected with mRNAs for BNip1b deletion mutants using anti-BNip1b antibody. Stable protein expression of BNip1b-ΔSNARE (lane 2), BNip1b-Δcc (lane 3) and BNip1b-ΔTM (lane 4) was confirmed. (B) Confocal scanning of 7 hpf embryonic cells expressing GFP-tagged full-length BNip1b, BNip1b-ΔTM, BNip1b-Δcc and BNip1b-!SNARE. GFP-tagged full length BNip1b is localized to membrane organelle-like structures surrounding the nucleus, which probably correspond to the ER, whereas all other BNip1 deletion mutant proteins are uniformly observed in both cytoplasmic and nuclear regions. (C) Eight hpf embryos injected with BNip1b-Δcc mRNA plus standard MO, MO-Bax1 and MO-Bax2. (D) Histogram of the percentage of 8 hpf embryos classified as class I–IV in the injection experiments shown in (C). (E) Percentage of class I/II embryos. Green and black bars indicate the mean and standard deviation, respectively. **p<0.01. The number of injection experiments shown in (E) and p-values from t-tests are shown in Table S2.

Acknowledgments
This image is the copyrighted work of the attributed author or publisher, and ZFIN has permission only to display this image to its users. Additional permissions should be obtained from the applicable author or publisher of the image.

Reprinted from Developmental Cell, 25(4), Nishiwaki, Y., Yoshizawa, A., Kojima, Y., Oguri, E., Nakamura, S., Suzuki, S., Yuasa-Kawada, J., Kinoshita-Kawada, M., Mochizuki, T., and Masai, I., The BH3-Only SNARE BNip1 Mediates Photoreceptor Apoptosis in Response to Vesicular Fusion Defects, 374-387, Copyright (2013) with permission from Elsevier. Full text @ Dev. Cell