
- Title
-
Tcf7l1 proteins cell autonomously restrict cardiomyocyte and promote endothelial specification in zebrafish
- Authors
- Sorrell, M.R., Dohn, T.E., D'Aniello, E., and Waxman, J.S.
- Source
- Full text @ Dev. Biol.

Tcf7l1a and Tcf7l1b restrict CM number. Hearts from (A) control, (B) Tcf7l1a deficient, (C) Tcf7l1b deficient, and (D) Tcf7l1 deficient embryos. Hearts of Tcf7l1a, Tcf7l1b, and Tcf7l1 deficient embryos are enlarged relative to controls. Hearts are frontal views. Red indicates ventricles. Green indicates atria. (E) CM number counts in control (n=20), Tcf7l1a deficient (n=22), Tcf7l1b deficient (n=20), and Tcf7l1 deficient (n=28) embryos. (F) Fold difference in CM number in Tcf7l1 individual and co-depleted embryos. (G) qPCR for myl7 expression. All analyses were at 48 hpf. Single asterisk indicates a statistically significant difference compared to controls. Double asterisks indicate statistically significant difference compared to control, Tcf7l1a deficient, and Tcf7l1b deficient embryos. |

Tcf7l1a and Tcf7l1b restrict CM differentiation marker expression. ((A)–(D)) Myl7, ((E)–(H)) vmhc, and ((I)–(L)) amhc expression via ISH in control, Tcf7l1a, Tcf7l1b, and Tcf7l1 deficient embryos at the 20s and 22s stages. In contrast to CM counts at 48 hpf, similar increases in the CM differentiation markers were observed in the individual Tcf7l1a and Tcf7l1b depleted embryos compared to the Tcf7l1 depleted embryos. (M) Fold difference in the areas of cells expressing the CM differentiation marker genes. For analysis of myl7, control n=38, Tcf7l1a deficient n=25, Tcf7l1b deficient n=22, and Tcf7l1 deficient n=26. For analysis of vmhc, control n=32, Tcf7l1a deficient n=23, Tcf7l1b deficient n=23, and Tcf7l1 deficient n=28. For analysis of amhc, control n=37, Tcf7l1a deficient n=26, Tcf7l1b deficient n=35, and Tcf7l1 deficient n=22. (N) qPCR for CM differentiation marker gene expression at the 22s stage. For both the area measurements and qPCR, amhc displayed more experimental variability than myl7 and vmhc, but did not reveal an increase in differentiation over the individually depleted Tcf7l1a or Tcf7l1b embryos as found counting atrial cells at a later stage. Images are from flatmounted embryos. Views are dorsal with anterior up. Asterisk indicates a statistically significant difference compared to controls. EXPRESSION / LABELING:
|

Expression of CM progenitor markers in Tcf7l1 deficient embryos. ((A)–(D)) Fgf8a and ((E)–(H)) nkx2.5 expression at the 8s stage in control, Tcf7l1a deficient, Tcf7l1b deficient, and Tcf7l1 deficient embryos. An increase in fgf8a and nkx2.5 markers relative to control sibling embryos was not observed in Tcf7l1a, Tcf7l1b, or Tcf7l1 deficient embryos at the 8s stage. ((I)–(L)) Nkx2.5 expression at the 14s stage in control, Tcf7l1a, Tcf7l1b, and Tcf7l1 deficient embryos. (M) Area and (N) fold difference of the area of nkx2.5 expressing cells at the 8s stage. For analysis of areas at 8 s, control n=16, Tcf7l1a deficient n=24, Tcf7l1b deficient n=24, and Tcf7l1 deficient n=18. (O) Area and (P) fold difference of the total area of nkx2.5 expressing cells at the 14s stage. For analysis of areas at 14s, control n=44, Tcf7l1a deficient n=37, Tcf7l1b deficient n=39, and Tcf7l1 deficient n=32. All views are dorsal with anterior up. Arrows in (A)–(D) indicate fgf8a expression that is associated with CM specification. Arrows in (E)–(L) indicate the length of nkx2.5 expression. Asterisk indicates a statistically significant difference compared to controls. EXPRESSION / LABELING:
|

Increased Wnt signaling prior to gastrulation promotes CM progenitor marker expression. ((A) and (B)) Fgf8a and ((C) and (D)) nkx2.5 expression at the 8s stage in control and wnt8.1 mRNA injected embryos. (E) Area and (F) fold difference in the areas of cells expressing fgf8a and nkx2.5. For analysis of fgf8a expression areas, control n=34 and wnt8.1 mRNA injected n=37. For analysis of nkx2.5 expression areas, control n=40 and wnt8.1 mRNA injected n=31. In contrast to what was observed in Tcf7l1 deficient embryos (Fig. 3), increased Wnt signaling prior to gastrulation from wnt8.1 mRNA injection expanded the expression of CM progenitor marker gene expression. All views are dorsal with anterior up. Arrows in (A)–(D) indicate the length of nkx2.5 and fgf8a expression. Asterisk indicates a statistically significant difference compared to controls. |

Depletion of Tcf7l1 proteins is epistatic to inhibition of Wnt signaling prior to gastrulation. Expression of myl7 in (A) control uninjected, (B) Dkk+/uninjected, (C) Tcf7l1 deficient, and (D) Dkk+/Tcf7l1 deficient embryos at the 20s stage. (E) Measurements of the area of myl7 expression cells and the fold difference in the area measurements. For analysis of myl7 expression areas, control n=29, Dkk+/uninjected n=21, Tcf7l1 deficient n=36, and Dkk+/Tcf7l1 deficient n=30. Images are from flatmounted embryos. Views are dorsal with anterior up. Double asterisks indicate statistically significant difference from control uninjected and Dkk+/uninjected embryos, but not different from each other. EXPRESSION / LABELING:
|

Tcf7l1s cell autonomously promote CM development. (A) Schematic of the cell transplantation strategy used for assessing cell autonomy. Red indicates injection with the rhodamine-dextran lineage tracer. (B) Representative image of a CM (arrow) that contributed to the heart from a WT/Tg(5.1myl7:EGFP) donor cell transplant into a WT host embryo. (C) Representative image of CMs (arrows) that contributed to the heart from a Tcf7l1 deficient/Tg(5.1myl7:EGFP) donor cell transplanted into a WT host. We found an increase in the frequency of CMs that contribute to the heart from Tcf7l1 deficient/Tg(5.1myl7:EGFP) donor cells and that these cells formed large clusters of CMs (Supplemental Table 1). (B) and (C) are frontal views. (D) Frequency of contribution to the heart from donor cells in transplantation experiments. Asterisk indicates a statistically significant difference compared to control transplant experiments. |
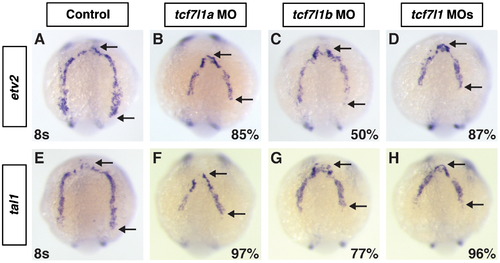
The expression domains of etv2 and tal1 are truncated in Tcf7l1 deficient embryos. ((A)–(D)) Etv2 and ((E)–(H)) tal1 expression at the 8 s stage in control, Tcf7l1a, Tcf7l1b, and Tcf7l1 deficient embryos. Etv2 and tal1 expression are slightly more truncated in Tcf7l1a deficient embryos compared to Tcf7l1b deficient embryos. The effects on etv2 and tal1 expression at this stage in Tcf7l1 deficient embryos is equivalent to Tcf7l1a deficient embryos. Images are dorsal with anterior up. Arrows in (A)–(H) indicate distance between the anterior and posterior limits of expression. EXPRESSION / LABELING:
|
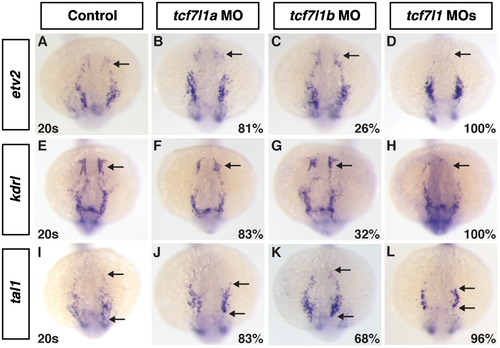
Anterior vasculature is absent in Tcf7l1 deficient embryos. ((A)–(D)) Etv2, ((E)–(H)), kdrl ((I)–(J)) tal1 expression at the 20s stage in control, Tcf7l1a, Tcf7l1b and Tcf7l1 deficient embryos. In Tcf7l1a and Tcf7l1b depleted embryos, there is a reduction in the anterior ECs ((B), (C), (F), (G)), with the defects in Tcf7l1a deficient embryos being more penetrant and stronger. Tcf7l1 deficient embryos have a complete loss of the ACEs ((D) and (H)). The more posterior expression of tal1 is reduced in Tcf7l1 deficient embryos compared to the individually depleted embryos. Images are dorsal with anterior up. Arrows in (A)–(H) indicate the ACEs. Arrow in (I)–(L) indicates the anterior and posterior limits of the tal1 expressing cells. EXPRESSION / LABELING:
|
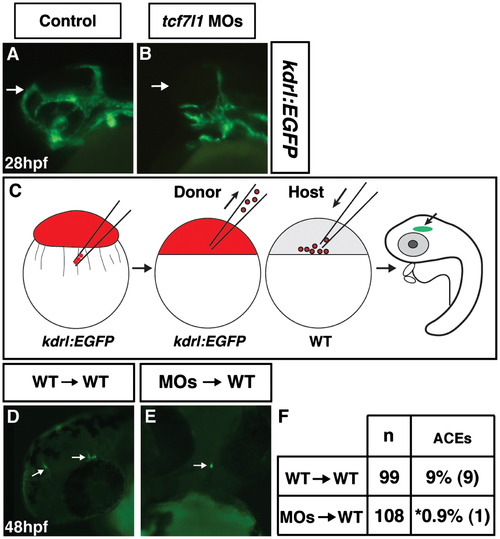
Tcf7l1s cell autonomously repress anterior endothelial cell development. ((A)and (B)) Control and Tcf7l1 deficient Tg(kdrl:EGFP) embryos. Tcf7l1 deficient Tg(kdrl:EGFP) embryos have a dramatic loss of the ACEs at 28 hpf. (C) Schematic of the cell transplantation strategy used for assessing cell autonomy. Red indicates injection with the rhodamine-dextran lineage tracer. (D) Representative image of cranial ECs from donor WT/Tg(kdrl:EGFP) cells transplanted into a WT host. View is fronto-lateral. (E) Representative image of cranial ECs from donor Tcf7l1 deficient/Tg(kdrl:EGFP) cells transplanted into a WT host. View is frontal. (F) Frequency of ACEs found in transplantation experiments. Asterisk indicates a statistically significant difference compared to control transplant experiments. |
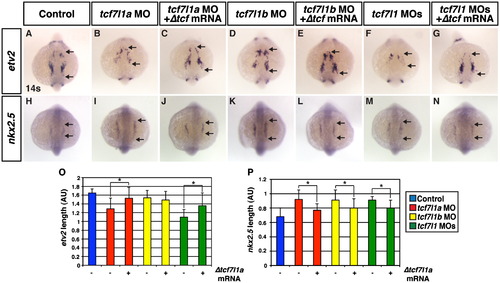
Tcf7l1 transcriptional repression is necessary to limit CM progenitors and promote hematovascular progenitor specification. ((A) and (H)) Control embryos. ((B)and (I)) Tcf7l1a deficient embryos. ((C) and (J)) Tcf7l1a deficient embryos co-injected with Δtcf7l1a mRNA. ((D) and (K)) Tcf7l1b deficient embryos. ((E) and (L)) Tcf7l1b deficient embryos co-injected with Δtcf7l1a mRNA. ((F) and (M)) Tcf7l1 deficient embryos. ((G) amd (N)) Tcf7l1 deficient embryos co-injected with Δtcf7l1a mRNA. ((A)–(G)) Tcf7l1a and Tcf7l1 deficient embryos have a decrease in etv2 expression, which is partially restored when Δtcf7l1a mRNA is co-injected. The defect in etv2 expression was less dramatic in Tcf7l1b than the Tcf7l1a and Tcf7l1 deficient embryos. ((H)–(N)) nkx2.5 expression is expanded in Tcf7l1 deficient embryos and partially rescued when Δtcf7l1a mRNA is co-injected. (O) Length of etv2 expression in control sibling and Tcf7l1 deficient embryos. (P) Length of nkx2.5 expression in control sibling and Tcf7l1 deficient embryos. Arrows indicate length of expression. All images are dorsal with anterior up. Asterisk indicates a statistically significant difference compared to controls. EXPRESSION / LABELING:
|

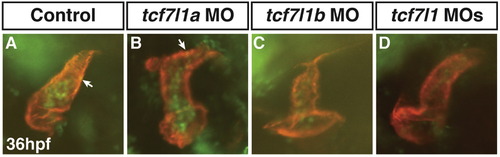
Efficacy of Tcf7l1 MOs demonstrating a functional interaction of Tcf7l1a and Tcf7l1b in promoting the anterior neural tissue. (A,E) Control embryos. (B,F) Tcf7l1a deficient embryos. (C,G) Tcf7l1b deficient embryos. (D,H) Tcf7l1 deficient embryos. We observed anterior neural patterning defects and functional interactions between Tcf7l1a and Tcf7l1b exactly as has been reported previously (Dorsky et al., 2003). Arrows in B and D indicate the length between the midbrain-hindbrain boundary and the anterior head, which is significantly shorter in the Tcf7l1 deficient embryos compared to the Tcf7l1a deficient embryos. |

Representative images of hearts with pHH3+ CMs. (A) Representative WT heart at 36 hpf. (B) Representative WT heart at 48 hpf. MF20 (red) was used to label CMs. pHH3+ cells (green; arrows) were easily discernible in the CMs and distinct from non-CMs when using the fluorescent stereomicroscope focusing through the heart. |
Representative images of hearts with EdU+ CMs. (A) Heart from control sibling embryo. (B) Heart from Tcf7l1a deficient embryo. (C) Heart from Tcf7l1b deficient embryo. (D) Heart from Tcf7l1 deficient embryo. MF20 (red) was used to label CMs. EdU+ cells (green; arrows in A and B) were easily discernible in the CMs and distinct from non-CMs when using the fluorescent stereomicroscope to focus through the hearts. The 30 min pulses of EdU labeled many additional cell types including blood, which can be seen in lumen of the hearts. |
Reprinted from Developmental Biology, 380(2), Sorrell, M.R., Dohn, T.E., D'Aniello, E., and Waxman, J.S., Tcf7l1 proteins cell autonomously restrict cardiomyocyte and promote endothelial specification in zebrafish, 199-210, Copyright (2013) with permission from Elsevier. Full text @ Dev. Biol.