
- Title
-
The zebrafish common cardinal veins develop by a novel mechanism: lumen ensheathment
- Authors
- Helker, C.S., Schuermann, A., Karpanen, T., Zeuschner, D., Belting, H.G., Affolter, M., Schulte-Merker, S., and Herzog, W.
- Source
- Full text @ Development
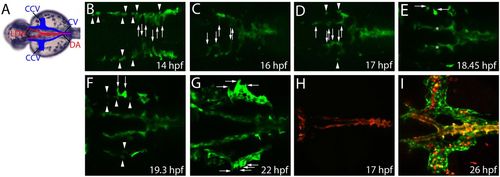
Venous angioblasts become specified as a separate population and at a different time point than arterial angioblasts. (A) Trunk vasculature of a zebrafish embryo. Veins are pseudocolored blue and arteries red. (B-G) Confocal projections from a time-lapse movie of a Tg(fli1a:EGFP)y1 embryo. (B) At the time point of their specification, angioblasts appear to have a round morphology (arrowheads). The angioblast that will form the DA begin to migrate to the midline of the embryo (arrows). (C) While posterior angioblasts forming the DA arrive at the midline at 16 hpf, angioblasts forming the LDA have just started to migrate (arrows). (D) At 17 hpf, most of the LDA-forming angioblasts have arrived at their final position (arrows). At the same time, a second population of angioblasts of round morphology appears in the region where the bilateral cardinal veins will develop (arrowheads). (E) Angioblasts of this second population start to become elongated and form filopodia (arrows). Asterisks indicate the first population forming the LDA. (F) Additional GFP-positive angioblasts become specified (arrowheads). Some angioblasts of the second population have lost their round morphology and the first cells begin to migrate (arrows) to form the CCVs. (G) At 22 hpf, angioblasts with multiple filopodia migrate (arrows) to form the CCVs, whereas other angioblasts remain in a more central position to form the bilateral cardinal veins. (H,I) Merged confocal projections of the green and red channel showing Kaede protein expression in a Tg(fli1ep:GAL4FF)ubs;(UAS:KAEDE)rk8 embryo. (H) Photoconversion of all endothelial cells (ECs) at 17 hpf, before the second population of angioblasts starts to express Kaede. Note that all ECs are photoconverted (red). (I) Arterial ECs in the LDA can be detected by both photoconverted (red) and new synthesized Kaede (green), whereas venous ECs in the bilateral cardinal veins and the CCVs only express newly synthesized Kaede (green). Note non-endothelial expression of Kaede by blood cells. All images represent dorsal views. Arrowheads, newly specified angioblasts; arrows, migrating angioblasts; DA, dorsal aorta; LDA, lateral dorsal aortae; CCV, common cardinal vein. EXPRESSION / LABELING:
|

All angioblasts show a common expression profile prior to arterial-venous differentiation. (A-I) Expression of cdh5 (A,D,G), flt1 (B,E,H) and flt4 (C,F,I) detected by in situ hybridization (dorsal views). Arrowheads indicate the venous angioblasts. All angioblasts (A) and ECs of the arteries and veins (D,G) express cdh5. All angioblasts express flt1 (B) and flt4 (C), before flt1 expression becomes downregulated in venous ECs (E,H) and flt4 becomes downregulated in arterial ECs (F,I). (J-L) Double fluorescent in situ hybridization for flt1 (red, J,K) and flt4 (green, J,L) shows that individual angioblasts express flt1 and flt4 mRNA at the same time (at 20 hpf these are located in the veins, J). EXPRESSION / LABELING:
|
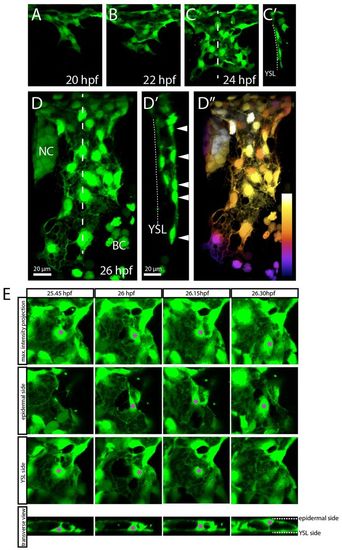
ECs of the CCV delaminate from the migrating sheet and align around the lumen. Confocal projections from time-lapse movies of a Tg(etsrp:EGFP)ci1 (A-C′,E) or a Tg(fli1a:EGFP)y1 (D-D′) embryo, dorsolateral views. (A-D′) At 20 hpf, ECs start to migrate to form a monolayer on top of the YSL (A-C′). Individual ECs delaminate from the YSL side and thereby align around a lumen (D′,E). At 26 hpf, an initial lumenized open-ended cylinder is formed (D-D′). This cylinder becomes extended by the ECs underneath the epidermis (arrowheads in D′). Sagittal sections based on 3D reconstructions of C and D (at the levels indicated by the dashed lines) show a monolayer and no lumen (C′) and a lumen (D′). Arrowheads in D′ point to the ECs migrating to extend the CCV. (D′) Depth color coding of the confocal maximum projection shown in D. Proximal-most structures are white, whereas darker colors represent more distal structures. (E) Delamination of a single EC (asterisk) from the endothelial monolayer on top of the YSL to the epidermal side of the CCV. To visualize this process, the second and third panels contain only part of the maximum projection: in the panels labeled ‘epidermal side’, ECs located on the YSL side are cropped away, whereas in the panels labeled ‘YSL side’, ECs located on the epidermal side are cropped away. NC, neural crest; BC, blood cells; YSL, yolk syncytial layer. EXPRESSION / LABELING:
|
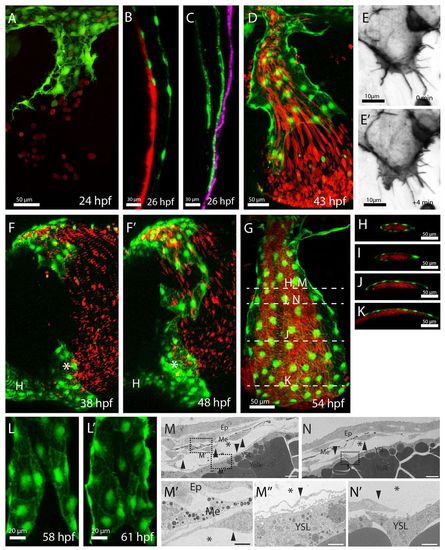
ECs of the CCVs form an open-ended tube before the onset of blood flow and consecutively extend this open vessel. The ECs form an open-ended tube with blood exiting the EC-lined lumen (A,D); the lumen becomes extended by active EC migration (E,E′), during which ECs migrate as a sheet underneath the epidermis (C) and connect to ECs at the heart inflow tract (asterisk, F,F′). Consecutively, the ECs engulf the blood-filled lumen (I,N) and fuse on the YSL side (L,L′). (A-L′) Confocal projections of the developing CCVs, lateral views (A,D,E,G,L), sagittal views (B,C), lateral-ventral view (F) and transverse views (H-K). (D,E,F,L) Projections taken from confocal time-lapse movies. The developing vasculature was visualized by transgenic EGFP expression of Tg(kdrl:EGFP)s843 (B,D,F,G), Tg(etsrp:EGFP)ci1 (A,L), by transgenic mCherry expression of Tg(kdrl:HsHRAS-mCherry)s896 (green in C) or by vascular-specific lifeact-GFP expression [Tg(UAS:lifeact-GFP)mu271 Tg(fli1ep:GAL4FF)ubs4] (E). The YSL was labeled by injection of mini-Ruby into the YSL (B). Erythrocytes are in red, visualized by transgenic dsRed expression of Tg(gata1:dsRed)sd2 (A,D,F-K). The epidermis is in purple [visualized by transgenic EGFP-caax expression of Tg(krt4:EGFP-caax)] (C). Note that the ECs underneath the epidermis extend the CCVs further (C) than on top of the YSL (B). ECs migrate actively with Actin-rich lamellipodia at their front (E,E′). (G-K) Ensheathment of the lumen by ECs; white bars in G indicate the approximate levels of the transverse views shown in H-K,M,N. (L,L′) Lumen closure on the YSL side. ECs of the epidermal side are cropped away. (M-N′) Electron micrograph (higher magnifications, M′,M′,N′) of the CCV of a 48 hpf embryo (scale bars: 10 μm). Arrowheads label ECs, asterisks the CCV lumen. Underneath the epidermis, ECs are next to melanocytes. On the other side of the lumen, ECs are located directly above the YSL. Note that in N there is no complete EC layer above the YSL. Ep, epidermis; Me, melanocytes; YSL, yolk syncytial layer. |

Cdh5 is required for delamination and lumen extension in the CCV. (A-D,F,G) Confocal projections of the CCV at 32 hpf (A-D) and 36 hpf (F,G) of Tg(kdrl:EGFP)s843 (C,D,F,G) or Tg(fli1a:EGFP)y1 (A,B) embryos. (A-D′) ECs of cdh5ubs8 mutant embryos (B,B′) fail to delaminate and do not align around the lumen. Lack of blood flow (tnnt2a MO, D,D2) does not influence lumen formation. (A2-D2) Transverse sections of A-D, showing the lumen (asterisk) imaged at the level of the dashed line in A-D. (E) Quantification of the length of the CCV. (F-H) Directionality of collective migration is impaired in cdh5ubs8 mutant embryos (G, white lines), whereas migration track length or speed was unaffected (H). Single ECs (red dots) were tracked for 4 hours. **P<0.01, ***P<0.001; n.s., not significant; error bars indicate s.e.m. |

Vegfc positively regulates EC proliferation in the CCVs. (A-D) Confocal projections of 32 hpf Tg(fli1al:EGFP)y1 wild-type (A) and homozygous vegfchu6410 mutant Tg(fli1al:EGFP)y1 (B) embryos, and of Tg(kdrl:EGFP)s843 embryos injected with H2B-cherry mRNA (control, C) or vegfc mRNA (D). (E) Quantification of EC numbers and proliferation rates in the CCVs. EC proliferation is decreased in vegfchu6410 or sFLT4 mRNA-injected embryos (B,E) and increased upon vegfc overexpression (D,E). Embryos were pulsed with BrdU from 24-32 hpf. (F,G) Expression of flt4 in the CCV (F, arrowheads) or vegfc in the area of CCV formation (G, bracket) detected by in situ hybridization at 29 hpf (F) or 32 hpf (G) in dorsal (F) or lateral (G) view. ***P<0.001; error bars indicate s.e.m. Ctr, control. |

Vegfc expressed from erythrocytes regulates EC numbers in the CCV. (A-C) Expression of vegfc in the region of the heart (arrows) in embryos injected with control MO (A), pu.1 MO (B) or gata1 MO (C) detected by in situ hybridization at 32 hpf; lateral views. (D,E) Quantification of EC numbers in the CCVs at 32 hpf (D) and 48 hpf (E). The number of ECs increased in embryos lacking macrophages (pu.1 MO-injected, D) and decreased in embryos lacking erythrocytes (gata1 MO-injected, D) or blood flow (tnnt2a MO-injected, E). (F-H) Confocal projections of Tg(etsrp:EGFP)ci1 CCV (F) and intersegmental vessel (Se) (G) at 44 hpf (lateral views) and comparison of the lumen diameter (H). The lumen diameter in the dorsal CCV is seven times larger and in the ventral CCV 20 times larger than that of the intersegmental vessel. Scale bars: 30 μm. (I) ECs start to proliferate with the onset of circulation. Until 24 hpf, ECs in the CCV still express the angioblast marker etsrp and only 5% proliferate. With the onset of circulation, proliferation of CCV ECs increases to 20%. Embryos were pulsed with BrdU at the indicated time points. (J) RT-PCR analysis of erythrocytes isolated from Tg(gata1:DsRed)sd2 embryos at 24 hpf and 48 hpf. gata1:DsRed positive (+) and negative (-) cells were isolated by FACS and analyzed for β-actin, gata1 and vegfc expression. **P<0.01, ***P<0.001; error bars indicate s.e.m. |

The angioblasts forming the bilateral cardinal veins and the common cardinal veins (CCVs) are specified as a second population and at a separate time point to the population forming the lateral dorsal aortae. (A-J) Confocal projections of Tg(fli1ep:GAL4FF)ubs4 (UAS:KAEDE)rk8 embryos at the indicated time points. Endothelial cells (ECs) (and blood cells) were visualized by transgenic Kaede expression. (A-G) Dorsal views; (H-J) lateral views. (A) EC-specific Kaede expression before photoconversion at 17 hpf, before the second population of angioblasts starts to express Kaede. (B) EC-specific non-converted Kaede (green) expression after photoconversion, indicating that not all Kaede protein was converted. (C) EC-specific converted Kaede (red) expression after photoconversion. (D) Merged image of converted and non-converted Kaede expression after photoconversion. (E) Non-converted Kaede expression, reflecting newly synthesized Kaede protein, imaged 9 hours after photoconversion. Green Kaede protein can be detected in the LDA and the bilateral cardinal veins as well as in the CCVs. (F) Nine hours after photoconversion, converted Kaede (red) expression can only be detected in the LDA, but not in the veins. (G) Merged image of the red and green channel showing Kaede expression 9 hours after photoconversion. Note that the transgenic Kaede expression can also be detected in blood cells. (H) Non-converted Kaede expression 9 hours after photoconversion is detected in the LDA and the bilateral cardinal veins as well as in the CCV. (I) Converted Kaede expression 9 hours after photoconversion is only detected in the LDA. (J) Merged image of the red and green channel showing Kaede expression 9 hours after photoconversion. Note that the transgenic Kaede expression can also be detected in blood cells. |

etsrp is strongly expressed in newly specified angioblasts but becomes downregulated after angioblast migration. (A-D,F) Brightfield images showing expression of etsrp (etv2) detected by in situ hybridization in embryos at the indicated time points (dorsal views). (A-C) Flat-mounted embryos; (D-G) higher magnification of the trunk region. (E,G) Brightfield images showing expression of cadherin 5 (cdh5) detected by in situ hybridization in embryos at the indicated time points (dorsal views). (A) etsrp mRNA can be detected in angioblasts within the lateral plate mesoderm. (B) etsrp mRNA levels are lower in angioblasts that have already migrated to the midline. (C) High etsrp expression in angioblasts that will form the bilateral cardinal veins/CCVs (arrowheads). (D) Cells forming the bilateral cardinal veins/CCVs show high levels of etsrp expression, whereas etsrp expression is very weak in the ECs of the LDA. (F) etsrp expression in the bilateral cardinal veins/CCVs decreases over time until it is no longer detectable. (E,G) cdh5 expression labels all angioblasts. CCV, common cardinal vein; LDA, lateral dorsal aortae. |

ECs of the CCV form tight and adherens junctions. (A-C) Fluorescent confocal images of immunostainings of the junctional proteins ZO-1 and Cdh5 at the indicated time points; lateral views. The developing vasculature is visualized by transgenic EGFP expression of Tg(fli1a:EGFP)y1. (A-A′′) ECs of the CCV express the tight junction protein ZO-1 and the adherens junction protein Cdh5 at 26 hpf. (B-B′′) ECs of the CCV express the tight junction protein ZO-1 and the adherens junction protein Cdh5 at 32 hpf. (C-C′′) ECs of the CCV express the tight junction protein ZO-1 and the adherens junction protein Cdh5 at 48 hpf. Note that the epidermis shows nonspecific Cdh5 staining at 48 hpf. |

ECs of the CCV have no apical polarization (analyzed by Podocalyxin-like 2 expression). (A-E′) Fluorescent confocal images of immunostainings of Podocalyxin 2 (Pdxl2) at the indicated time points; lateral views. The developing vasculature is visualized by transgenic EGFP expression of Tg(kdrl:EGFP)s843. ECs of the CCV do not form Pdxl2-positive membrane compartments, whereas ECs in the fin bud (arrows in D′ and right arrow in E′) and ECs in the aortic arches (left arrow in E′) form apical membrane compartments as indicated by Pdxl2 staining. |

CCV development is not affected by blood flow, melanocytes or endoderm. (A-F) Confocal fluorescent images of transgenic zebrafish embryos at the indicated time points. ECs were visualized by transgenic EGFP expression [Tg(kdrl:EGFP)s843]. (A-D) Lateral views; (E,F) dorsal views. (A,B) Embryos injected with control MO (A) or with tnnt2a MO (B). Note that the CCV developed normally in the absence of blood flow in tnnt2aMO-injected embryos (B). (C,D) Embryos injected with control MO (C) or mitfa MO (D). Note that although mitfa MO-injected embryos had no melanocytes (compare brightfield images, insets in C and D) the CCVs developed normally. Arrows indicate melanocytes in C. (E,F) Embryos injected with control MO (E) or with sox32 MO (F). Note that in the absence of endoderm the LDA fail to form (asterisks), whereas the CCVs develop (F). CCV, common cardinal vein; Ctr, control; LDA, lateral dorsal aortae; WT, wild type. |

Vegfc positively regulates EC proliferation in the CCVs. Confocal projections of 32 hpf Tg(kdrl:EGFP)s843 wild-type siblings (A), homozygous vegfchu6410 mutant embryos (B) or embryos injected with H2B-cherry mRNA (control, C), vegfc mRNA (D) or sFLT4 mRNA (E), all pulsed with BrdU from 24-32 hpf. BrdU staining is shown in red; vascular ECs are visualized in green by staining for GFP expression [of Tg(fli1al:EGFP)y1 in A,B and of Tg(kdrl:EGFP)s843 in C-E]. EC proliferation is decreased in vegfchu6410 (B) or sFLT4 mRNA-injected (E) embryos and increased upon vegfc overexpression (D). Arrowheads mark BrdU-positive ECs in the CCV. |