
- Title
-
Real-time in vivo monitoring of circadian E-box enhancer activity: A robust and sensitive zebrafish reporter line for developmental, chemical and neural biology of the circadian clock
- Authors
- Weger, M., Weger, B.D., Diotel, N., Rastegar, S., Hirota, T., Kay, S.A., Strähle, U., and Dickmeis, T.
- Source
- Full text @ Dev. Biol.
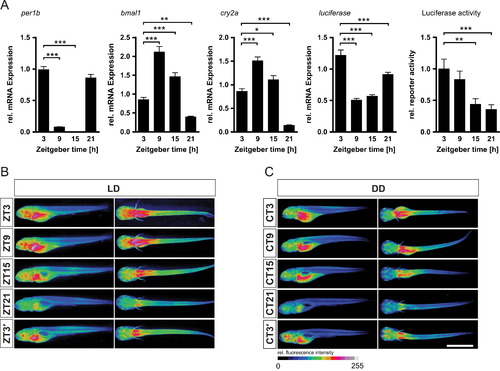
Spatiotemporal analysis of Tg(4xE-box:Luc) reporter activity in larvae. (A) mRNA expression levels as determined by RT-qPCR for the endogenous clock genes per1b, bmal1 and cry2a as well as for the luciferase reporter in 5 dpf Tg(4xE-box:Luc) larvae under LD. Shown are also the levels of bioluminescence of 5 dpf larvae (n=44) recorded at the time points with the plate reader corresponding to mRNA analysis. ((B) and (C)) Luciferase expression shows diurnal (B) and circadian (C) changes across all tissues of the larvae. Immunohistochemistry with an anti-luciferase antibody and an Alexa Fluor 488 labeled secondary antibody. Relative fluorescence intensity is shown color coded. Representative images of larvae sampled at 5 dpf at five different time points during LD (ZT3-ZT32 B) or DD (CT3-CT32 C) after a 4 day entrainment period. Scale bar, 1.0 mm. EXPRESSION / LABELING:
|

The Tg(4xE-box:Luc) line is able to detect compounds affecting core clock activity. To show that the Tg(4xE-box:Luc) line is a suitable tool for screens of small molecules affecting the clock core loop, embryos/larvae were entrained over several days and then treated on 5 dpf with different concentrations of either ((A)–(C)) longdaysin (0–9 μM) or ((D)–(E)) lithium chloride (LiCl; 0–20 mM). DMSO controls are identical for both treatments, and the data are shown both in panel A and panel D to allow for easy comparison with the treatments. After the drug treatment, bioluminescence was measured under constant darkness to determine the drug effect on the clock period. The results showed a dose dependent period lengthening of larvae treated with longdaysin with the strongest effect (τ=34.9±0.6 h) observed at 9 μM longdaysin ((A) and (B)). 10 mM of LiCl did not cause any detectable effect on the period, while 20 mM significantly lengthened the period for 0.7 h ((D)and (E)). Both drugs did not affect survival or larval development ((C) and (F)). Scale bar, 1.0 mm. Error bars represent mean values ±SEM. |

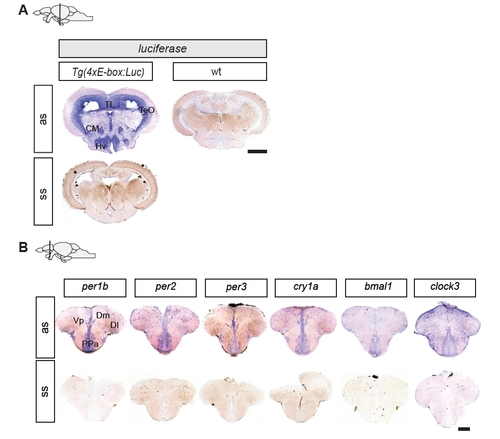
Luciferase expression overlaps with various neurogenic areas and matches clock gene expression throughout the brain. (A) Comparison of luciferase and endogenous clock gene in situ hybridization on adult brain sections. Rows show in situ hybridizations with antisense probes for the indicated genes and timepoints. Columns display brain sections at the level of the telencephalon (left), diencephalon (middle), and mesencephalon (right). Top row: schematic lateral views of the adult zebrafish brain indicating the section level. Luciferase transcripts are detected in the dorsal telencephalic area (D), and in the ventral (Vv), the dorsal (Vd) and the central (Vc) nuclei of the ventral telencephalon. More posteriorly, reporter expression is detected in the preoptic area (PPa), the posterior post-commissural nucleus of the ventral telencephalon (Vp), and in the dorsomedian (Dm) and dorsolateral (Dl) telencephalon. In more caudal sections, luciferase transcripts are detected in the periglomerular gray zone (PGZ) of the optic tectum (TeO), the valvula of the cerebellum (VCe), the torus longitudinalis (TL), the corpus mamillare (CM) as well as in the ventral (Hv) and dorsal (Hd) zones of the periventricular hypothalamus. Expression of all the examined endogenous clock genes shows extensive overlap with luciferase expression. (B) Schematic indication of anatomical subdomains at the levels of the sections in (A) (modified from Wullimann et al. (1996)). Indicated in red are zones of proliferation. Scale bar, 250 μm. EXPRESSION / LABELING:
|
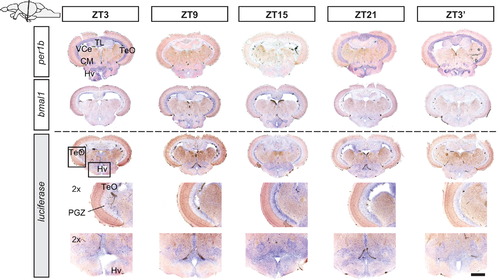
Diurnal time course of per1b, bmal1 and luciferase mRNA expression. Schematic (upper left corner) indicates the level of the sections shown in the figure. Rows: time points at which fish were sacrificed (ZT3, ZT9, ZT15, ZT21, and ZT32 on the following day). Rows show in situ hybridizations with antisense probes for the indicated genes. Rows 4 and 5 show magnifications of the luciferase staining in the optic tectum (TeO, PGZ) and ventral hypothalamus regions (Hv), respectively, as indicated by the boxes in row 3. Scale bar, 250 μm and 125 μm for high magnifications. EXPRESSION / LABELING:
|
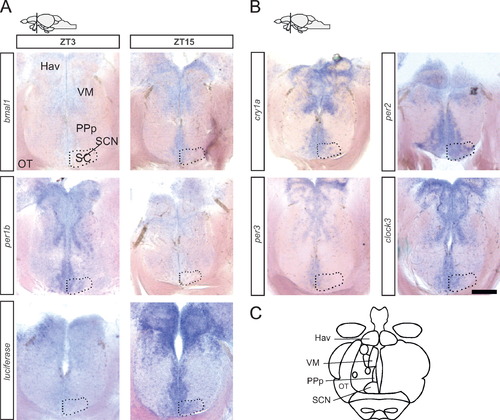
Luciferase reporter and clock gene expression in the suprachiasmatic nucleus. Schematic (upper left corner) indicates the level of the sections across the anterior hypothalamic region shown in the figure. (A) In situ hybridization against luciferase, bmal1 and per1b at two opposite time points of the diurnal cycle (ZT3 and ZT15). Bmal1 and luciferase expression levels are higher at ZT15 than at ZT3, while per1b is higher at ZT3. (B) In situ hybridization of different clock genes at ZT3 (cry1a, per2, per3) and ZT9 (clock3). (C) Schematic indication of anatomical subdomains at the section level shown in (A) and (B) (modified from Wullimann et al. 1996). Abbreviations: Hav, ventral habenular nucleus; VM, ventromedial thalamic nucleus; PPp, parvocellular preoptic nucleus, posterior part; OT, optic tract; SCN, suprachiasmatic nucleus (indicated in all panels by dotted outline). Scale bar, 140 μm. EXPRESSION / LABELING:
|

Radial glial and non-radial glial progenitors express the luciferase reporter. ((A) and (B)) Luciferase (red), S100β (green) and PCNA (blue) expression at two different levels of the telencephalon at ZT15. ((A2), (B2) and (B3)) Higher magnifications of the corresponding framed regions in A and B. Luciferase transcripts are abundantly detected along the ventricular/periventricular layer (arrows in A and A2). Luciferase mRNA is notably expressed in S100β positive radial glial cells, both in proliferating (type II) progenitors (higher magnification in B2, yellow spots show luciferase mRNA staining granules in one S100β+ cell) and in non-proliferating (type I) progenitors (arrows in B2). A magnification of the framed region in B2 is shown with the three color channels separated as well as merged. At the rostral migratory stream-like strip (RMS), proliferating S100β-negative cells (type III progenitors) also exhibit luciferase expression (arrows in B′′). Dl, dorsolateral telencephalon; Dm, dorsomedian telencephalon; RMS, rostral migratory stream-like strip; Vd, dorsal nucleus of the ventral telencephalon; Vv, ventral nucleus of the ventral telencephalon. Scale bar corresponds to: (A) 110 μm; (A2) 33 μm; (B) 130 μm; (B2) 25 μm; (B3) 20 μm. All pictures shown represent a single 1.5 μm confocal plane. |

|
|

|
Reprinted from Developmental Biology, 380(2), Weger, M., Weger, B.D., Diotel, N., Rastegar, S., Hirota, T., Kay, S.A., Strähle, U., and Dickmeis, T., Real-time in vivo monitoring of circadian E-box enhancer activity: A robust and sensitive zebrafish reporter line for developmental, chemical and neural biology of the circadian clock, 259-73, Copyright (2013) with permission from Elsevier. Full text @ Dev. Biol.