
- Title
-
Activated N-Ras signaling regulates arterial-venous specification in zebrafish
- Authors
- Ren, C.G., Wang, L., Jia, X.E., Liu, Y.J., Dong, Z.W., Jin, Y., Chen, Y., Deng, M., Zhou, Y., Zhou, Y., Ren, R.B., Pan, W.J., and Liu, T.X.
- Source
- Full text @ J. Hematol. Oncol.
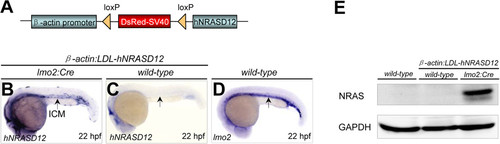
Validation of hNRASD12 expression in the β-actin:LDL-hNRASD12;lmo2:Cre transgenic embryos. (A) Diagrammatic scheme of the β-actin-LDL-hNRASD12 transgenic construct. (B-D) The expression analyses of the hNRASD12 transcripts via whole mount in situ hybridization (WISH) in the β-actin:LDL-hNRASD12;lmo2:Cre embryo (hereafter referred as hNRASD12 embryo) (B) and β-actin:LDL-hNRASD12;wild-type embryo (hereafter referred as control embryo) (C) respectively at 22 hours post fertilization (hpf), and lom2 transcripts in the wild-type embryo at 22 hpf (D). Black arrows denote the location of the intermediate cell mass (ICM) region. (E) Confirmation of the expression of hNRAS protein in the hNRASD12-embryos at 28 hpf via western blotting analysis. EXPRESSION / LABELING:
|

The primitive erythropoiesis and myelopoiesis are not affected by the expression of hNRASD12. (A-B) WISH analysis of primitive hematopoietic markers expression in the control embryos and hNRASD12expressing embryos respectively at 18 (A) and 22 hpf (B). (C-D) Verification of the expression level of the hematopoietic markers in the control or hNRASD12 embryos at 18 (C) and 22 hpf (D) via real-time quantitative PCR. Data shown are means ± SEM of at least three independent experiments. EXPRESSION / LABELING:
|
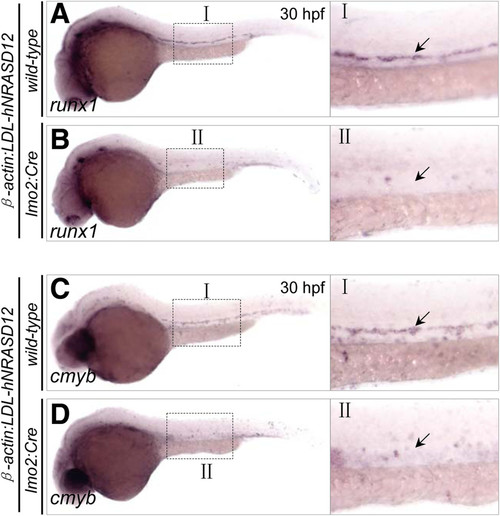
The definitive hematopoiesis is disrupted in the hNRASD12-expressing embryos. (A-D) WISH analysis of runx1+ and cmyb+ definitive hematopoietic stem cells (HSCs) in the aorta-gonad-mesonephros (AGM) region of the trunk in the control (A, C) and hNRASD12 embryos (B, D) at 30 hpf (arrows). EXPRESSION / LABELING:
|
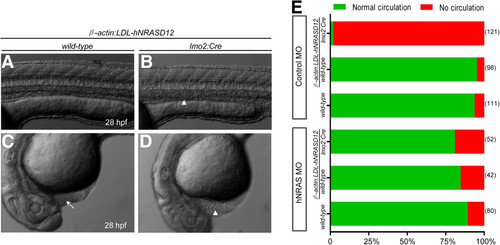
The expression of hNRASD12 blocks the blood circulation. (A-D) Morphology of the control (A &C) and hNRASD12 embryos (B &D) at 28 hpf. The arrows mark the blood flow in the trunk and heart of control embryo, and the triangles denote the accumulated blood cells in the trunk and heart of hNRASD12 embryo. (E) The assessment of blood circulation in wild-type, control and hNRASD12 embryos after injection of control and hNRAS morpholino (MO) respectively; the numbers on the right of the bars indicate the amount of the embryos being counted, and representative results obtained from three independent experiments. PHENOTYPE:
|

Vasculogenesis is disrupted in hNRASD12-expressing transgenic embryos. (A-B) Confocal images of trunk vasculature of living control; flk1:GFP (A) and hNRASD12;flk1:GFP embryos (B) at 28 hpf. DA, dorsal aorta; PCV, posterior cardinal vein; ISV, intersegmental vessel. (C-D) Mid-trunk transverse sections of control;flk1:GFP (C) and hNRASD12;flk1:GFP embryos (D) at 28 hpf stained by GFP antibody (green) and Phalloidin-TRITC (red). NT, neural tube; NC, notochord. (E-J) Confocal images of head vasculature of living control;flk1:GFP (E, G, I) and hNRASD12;flk1:GFP embryos at 28 hpf (F, H, J). LDA, lateral dorsal aorta; PHBC, primordial hindbrain channel; CCV, common cardinal vein; BA, basilar artery. The red dotted lines denote the boundaries of the CCVs and PCVs respectively. |
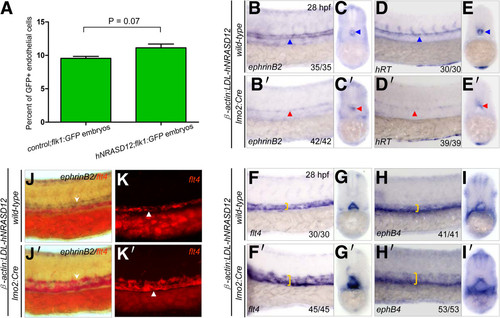
Expression of hNRASD12 promotes venous specification at the expense of arterial fate during embryonic endothelial differentiation. (A) Quantitation of total endothelial cells by flow cytometry analysis on the control;flk1:GFP and hNRASD12;flk1:GFP embryos at 28 hpf. Representative results obtained from three independent experiments. 2 tailed t-test of frequency of endothelial cells in hNRASD12;flk1:GFP embryos vs control;flk1:GFP embryos shows no significant difference. (B-E′) WISH analysis of ephrinB2+ and hRT+ arterial cells in the trunk of control (B-E, blue triangles) and hNRASD12 embryos (B′-E′, red triangles) at 28 hpf. (F-I′) WISH analysis of flt4+ and ephB4+ venous cells in the trunk of control (F-I) and hNRASD12 embryos (F′-I′) at 28 hpf. The yellow square brackets mark the width of the venous strip in the trunk. (J-K′) 2-color WISH analysis with digoxigenin-labeled ephrinB2 (white arrows) and fluorescein-labeled flt4 (white triangles) in control (J, K) and hNRASD12 embryos (J′, K′) respectively at 28 hpf. |
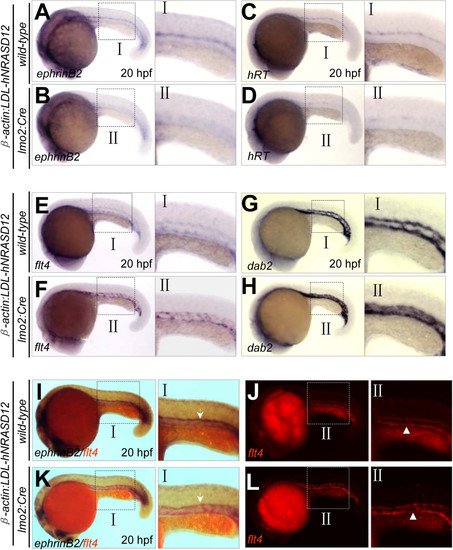
Loss of arterial specification by hNRASD12 expression before arterial-venous segregation and onset of circulation. (A-H) WISH analysis of arterial (ephrinB2+, hRT+) and venous (flt4+, dab2+) cells in the trunk of control (A, C, E, G) and hNRASD12 embryos (B, D, F, H) at 20 hpf respectively. (I-L) 2-color WISH analysis with digoxigenin-labeled ephrinB2 (white arrows) and fluorescein-labeled flt4 (white triangles) in control (I, J) and hNRASD12 embryos (K, L). EXPRESSION / LABELING:
PHENOTYPE:
|

The medial migration of angioblasts in the posterior bilateral mesoderm is not affected by the activated N-Ras signaling. (A-J) The distribution of flk1+ angioblasts at the posterior lateral plate mesoderm in the control (A-E) and hNRASD12 embryos (F-J) from 14 to 18 hpf. EXPRESSION / LABELING:
|