
- Title
-
Characterization of harpy/Rca1/emi1 mutants: patterning in the absence of cell division
- Authors
- Riley, B.B., Sweet, E.M., Heck, R., Evans, A., McFarland, K.N., Warga, R.M., and Kane, D.A.
- Source
- Full text @ Dev. Dyn.
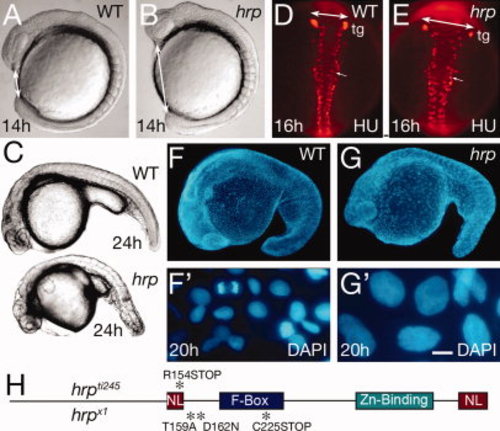
General phenotype of harpy mutants. A,B: Live wild-type (WT) and mutant embryos at the 10 somite stage. Double sided arrows indicate the distinctive nose–tail bud separation in the mutants. C: Side views of live wild-type and mutant embryos at 24 hr. D,E: Anti-HuC (HU) stained neurons at 16 hr in wild-type and mutant embryos. The trigeminal ganglia (tg) are indicated, and double sided arrows indicate the width of the neural keel. Small arrows indicate single cells; note the larger size of the mutant cells. F,G: The 42,6-diamidine-2-phenylidole-dihydrochloride (DAPI) staining at 20 hr in wild-type and mutant embryos. F2 and G2 are whole embryo dissociations. Note the cell in mitosis in the WT field; no cells are found in mitosis in the mutants. H: Rca1/emi1 coding region showing individual protein domains and the locations of point mutations (asterisks) found in hrpti245 and hrpx1 mutants. Scale bar = 50 μm in D,E, 5 μm in F2,G2. PHENOTYPE:
|

Cycle characterization of cells in harpy mutants. A–F: Anti-phospho-histone H3 (pH3) staining in wild-type and harpy mutant embryos from 6 through 24 hr showed that typically by 8 hr no cells are in mitosis. Only occasional cells were pH3 positive at 24 hr (F). G: Mean number of cells per embryo, based on cell counts. Cells were counted after dissociating individual embryos with collagenase. Each time point shows the mean and standard deviation from 10 embryos. H–N: Bromodeoxyuridine (BrdU) incorporation in wild-type and harpy mutant embryos. H shows an harpy mutant injected at 14 hr and fixed 10 hr later. I–N shows embryos injected and fixed 45 min later. Note that at 30 and 42 hr many cells were positive in mutants; however, at 48 hr, mutants were mostly negative except for a small focus of BrdU incorporation in the tail. Scale bar = 100 μm in A–F, 85 μm in H,J,K,M,N, 200 μm in I,L. |

harpy mutant cells stop dividing at cell cycle 14. A–D: Dorsally derived fates (A,B), and ventrally derived fates (C,D). In each embryo, an individual blastomere was labeled at cycle 11 or 12 and followed by time-lapse video microscopy through early segmentation. Each is restricted to a deep cell lineage (d) or an EVL (e) lineage at the cycle after labeling. The reconstructed cell lineage is displayed by cell cycle. Twenty-four hour histotypes and cell counts for the clones are shown at the bottom of the lineage tree, and left side views of the 24 hr embryos are shown below. E–I: Comparison of different cell types at 24 hr. Whereas notochord cells (E) were normally sized in the mutants, neurons (F) and muscle cells (G) were larger, and blood cells (H) and periderm cells (I) were supersized. In our lineage studies we never saw axons sprouted from presumptive neurons in mutants. Wild-type cells, green; harpy mutant cells, red. edc, endothelial cell; hgl, hatching gland; mus, muscle; nc, notochord; pdm, periderm; rbc, red blood cell. Scale bar = 100 μm in E–I. |

Neural patterning defects in harpy mutants. Panels show wild-type reference embryos and harpy mutants. A–D: Expression of pax2a at 24 hr. Note that the diminution of expression in each domain is the result not of lowered expression in individual cells but of lower total numbers of positive cells. A,C: Whole-mount side views; insets show dorsal views of head-trunk region. B,D: High resolution dorsal views of hindbrain. E–K: Expression of islet1 at 24 hr. E,H: Whole-mount side views; insets show dorsal views of head region. The midline of the central nervous system (CNS; black line) is indicated near the epiphysis. F,G,I–K: Transverse sections at levels indicated in whole-mounts. Note lacking primary motor neurons, normally a bilaterally paired structure. L–O: Expression of foxa2 (axial) at 24 hr. L,N: Show a whole-mount side view; insets show dorsal views of head region. M,O: Show high resolution side views of trunk. Note the gaps between the large cells of the mutant floor plate and hypochord. bmn, branchio-motor nuclei; dc, diencephalon; ep, epiphysis; ed, endoderm; fp, floor plate; hbn, hindbrain neurons; hc, hypochord; mhb, midbrain–hindbrain border; nc, notochord; os, optic stalk; ov, otic vesicle; pcr, pancreas; pp, pharyngeal pouch; pmn, primary motor neurons; prn pronephric neck; prt pronephric tubule; prd, pronephric duct; px, pharynx; rb, Rohon-Beard sensory neuron; scn, spinal cord neurons; tc, telencephalon; vb, ventral brain. Scale bar = 100 μm in A,C,E,H,L,N, 40 μm in B,D,F,G,I,J,K,M,O. EXPRESSION / LABELING:
PHENOTYPE:
|

Neural patterning defects in harpy mutants. Panels show wild-type control embryos and harpy mutants. A,B: Expression of deltaA (dlA) at 24 hr. Dorsal view of hindbrain. Note the normal intensity of expression in mutant cells. C,D: Expression of notch1b at 24 hr. Dorsal view of head; insets show lateral view. Note expression in mutants is almost absent. E,F: Expression of fgf8 at 24 hr. Dorsal view of hindbrain. Note ectopic staining in the fourth rhombomere of the mutant. G,H: Anti-Pax7 staining at 24 hr. Arrows indicate neural crest cells migrating over the eye and pharyngeal arches; while these cells are present in the mutant, they are not seen on the migration pathway. I,J: Dorsal view of 3A10-stained Mauthner neurons at 30 hr, displaying abnormal pathfinding and absence of axons in the mutants. K,L: Anti-Grasp staining at 30 hr; dorsal view of the hindbrain. Arrows indicate commissural neurons that in the mutant are chaotic. M,N: Anti-acetylated tubulin (AT) staining at 24 hr; dorsal view of the trunk. Although axons are present in mutants, they do not express acetylated tubulin except in the tail region. mhb, midbrain–hindbrain border; mth, Mauthner neurons; ov, otic vesicle; r4, fourth rhombomere. Scale bar = 50 μm in A–D, 20 μm in F,G, 100 μm in E–N. |
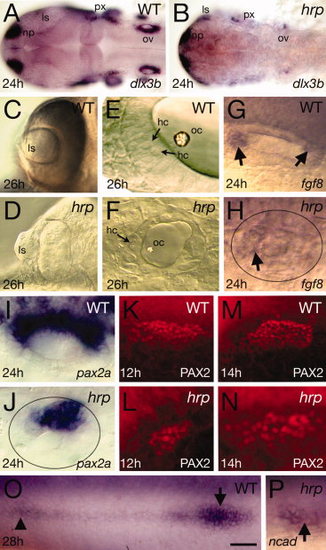
Placodal patterning defects in harpy mutants. Panels show wild-type reference embryos and harpy mutants. A,B: Expression of dlx3b at 24 hr, showing reduced numbers of positive-expressing cells in the mutant. C,D: Optic vesicles in live embryos at 26 hr, showing extruded lens in the mutant. E,F: Otic vesicle in live embryos at 26 hr. Arrows indicate hair cells. Note the absence of layers and miniaturized structures in the mutant. G,H: Expression (arrows) of fgf8 at 24 hr in the otic vesicle. Note that expression is almost absent in the mutant vesicle (demarcated by oval). I–N: Expression of pax2a in the otic tissue. I,J: pax2a mRNA at 24 hr in the otic vesicle. Note that expression reduced in the mutant vesicle (demarcated by oval). K–N: Staining with anti-PAX2 in the otic placodes, showing expansion of the PAX2 territory between 12 and 14 hr in the mutant. O,P: Expression of N-cadherin (ncad) at 24 hr, showing a rosette of the lateral line (arrow head) and the lateral line primordia (arrow). In many mutants, the primordia could not be found. ls, lens; hc, hair cells; np, nose placode; oc, otocyst; op, otic placode; ov, otic vesicle; px, pharynx. Scale bar = 100 μm in A,B, 50 μm in C,D, 10 μm in E,F, 20 μm in G–P. EXPRESSION / LABELING:
PHENOTYPE:
|

Patterns of bromodeoxyuridine (BrdU) incorporation. A–I: Images show lateral views with anterior to the left (A,B,E,F,H) or dorsal views with anterior to the top (C,I) or to the left (D,G). A,B: Head region of a wild-type embryo and harpy mutant incubated with BrdU from 18 to 24 hr. Note that the majority of cells incorporate BrdU in both mutant and wild-type embryos. C–I: harpy mutants injected with BrdU at 12 hr and fixed later at 19 hr. Note that in all the cases shown, cells that express the indicated marker of differentiation (black) never incorporate BrdU (green). C: Anti-Engrailed stained midbrain–hindbrain border. D,E: Anti-Isl1/2 staining showing Rohon-Beard sensory neurons and trigeminal ganglia. F: Anti-Engrailed stained muscle pioneers. G: Anti-Pax2 stained spinal interneurons. H: Anti-Pax2 stained pronephric cells. I: 3A10 antibody-stained Mauthner neurons; these were fixed at 27 hr. mhb, midbrain–hindbrain border; mp, muscle pioneers; Mth, Mauthner neurons; prt, pronephros; sin, spinal interneurons; rb, Rohon-Beard sensory neurons; tg, trigeminal ganglia. Scale bar = 100 μm in A,B, 75 μm in C, 30 μm in D–G,I, 15 μm in H. EXPRESSION / LABELING:
PHENOTYPE:
|

harpy acts both cell autonomously and non-autonomously. A–F: Examples of transplanted wild-type (green) and mutant (red) cells placed in either a wild-type (A,C,E,F) or mutant (B,D) host. A,B: Composite images of a neural and muscle chimera. C: Ultraviolet (UV) image showing a magnified view of neural and muscle chimera in A. Inset shows single harpy interneuron which projected an axon. D: magnified views of neural chimera in B. Note that the wild-type cells did not project axons. E,F: Facial view of telencephalic region (E) and dorsal view of brain (F) neural clones. Note that wild-type cells frequently cross the midline; mutant cells tend to not. G: Comparison of number of cells in clones. For each chimera, two to three cells from two separate individuals were placed into a host embryo at 5 hr, and recorded immediately afterward (txp), then at 6 hr and again at 30 hr. H,I: Mosaic embryos double stained with HRP to detect donor cells (brown/black) and anti-phospho histone H3 to detect mitotic cells (green). H,H2: Labeled mutant cells transferred to an wild-type host; mutant cells are not dividing. I,I2: Labeled wild-type cells transferred to an unlabeled mutant host. A dividing wild-type cell is indicated (arrow). Scale bar = 200 μm in A,B,E,F, 50 μm in C,D, 100 μm in F,I. |

Unillustrated author statements PHENOTYPE:
|