
- Title
-
Activation of canonical Wnt/beta-catenin signaling stimulates proliferation in neuromasts in the zebrafish posterior lateral line
- Authors
- Head, J.R., Gacioch, L., Pennisi, M., and Meyers, J.R.
- Source
- Full text @ Dev. Dyn.
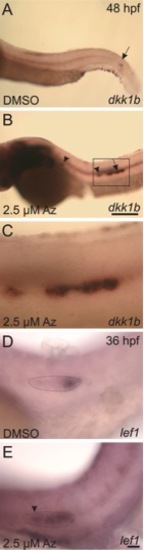
Expression of the Wnt targets dkk1 and lef1 is upregulated in the lateral line primordium in response to treatment with 2.5 μM Az beginning at 24 hpf. A–C: In situ hybridization with a probe against dkk1 shows normal expression in control, DMSO-treated embryos at 48 hpf (A) restricted to a narrow domain of the lateral line primordium (arrow), which has migrated almost to the tail. In contrast, in fish at 48 hpf treated with Az (B), the primordium has only migrated to approximately halfway along the yolk-extension, and dkk1 is expressed throughout the primordium (arrow) and remains elevated in deposited neuromasts (arrowheads). The boxed area is shown at higher magnification in C. D,E: In situ hybridization in DMSO-treated control fish at 36 hpf (D) shows normal expression of lef1 at the leading edge of the primordium (outlined with the dotted line). In Az-treated fish at 36 hpf, lef1 is expressed throughout the primordium and in the rosette about to be deposited (arrowhead). Scale bars: A,B = 250 μm; C–E = 25 μm. |
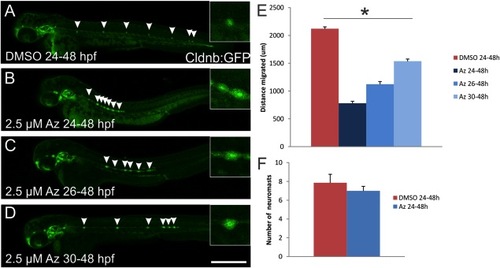
Pharmacological inhibition of GSK3β with Az limits migration of the lateral line primordium. Whole-mount confocal examination of Tg(cldnb:gfp) zebrafish at 48hpf shows the extent of lateral line primordium migration and the location of deposited neuromasts (arrowheads). A: Embryos treated with DMSO as a vehicle control from 24–48 hpf deposit 7–9 neuromasts extending from the ear to the end of the tail. B: Embryos treated with 2.5 μM Az from 24–48 hpf show greatly reduced migration of the primordium, though 7–9 neuromasts were still deposited. C,D: Delaying the onset of Az treatment to 26 hpf (C) or 30 hpf (D) allowed the primordium to migrate further down the tail, but had little effect on the number of deposited neuromasts. In addition to the distance migrated, the size of the neuromasts in Az-treated fish appears larger than controls (insets show magnified view of the central-most neuromast for each fish). E: Quantification of the distance along the lateral midline beginning at the otic vesicle that the primordium had migrated by 48 hpf (n = 6 embryos per condition) in fish treated at varying times with Az or DMSO as a control. All pairwise comparisons between conditions are statistically significant (P < 0.05; ANOVA with post-hoc Tukey). F: Quantification of the number of deposited neuromasts at 48 hpf in fish treated with DMSO or Az at 24 hpf. Though Az significantly reduced the migration of the primordium, there was no significant effect on the number of deposited neuromasts (P > 0.05; t-test). Scale bar = 500 μm. |
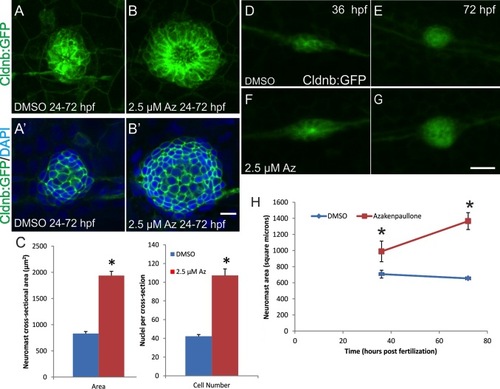
Az leads to increased size of deposited neuromasts and increased growth of the neuromasts following deposition. Tg(cldnb:gfp) zebrafish were treated with either 2.5 μM Az or DMSO as a vehicle control from 24–72 hpf. A,B: Projections of z-stacks showing the difference in size of the second-most anterior neuromast from DMSO-treated (A) or Az-treated (B) zebrafish. A′,B′: Individual z-sections from different neuromasts from DMSO- (A′) and Az-treated (B′) zebrafish showing the cross-sectional area of the neuromast (labeled with cldnb1:gfp) and the nuclei (DAPI; blue) in that cross-section. C: Quantification of the cross-sectional area of the neuromasts and number of nuclei in a cross-section through the neuromast reveals that Az treatment leads to a more than doubling in the area and number of cells in the neuromast (*P < 0.0001 for both; t-test). D–H: Time-lapse microscopy of Tg(cldnb:GFP) zebrafish treated from 26–72 hpf with DMSO (D,E) or 2.5 μM Az (F,G). Individual frames from one representative time-lapse are shown at 36 hpf (D,F; shortly after the deposition of the imaged neuromast) and at 72 hpf (E, G; approximately 36 hr after deposition of the imaged neuromast). H: Quantification of neuromast size at 36 and 72 hpf. The size of the deposited neuromast at 36 hpf is significantly larger in Az-treated fish compared to DMSO-treated controls. While control neuromasts decrease slightly in area over the next 36 hr as the neuromast condenses, Az-treated neuromasts increase in size by more than 33% (*P < 0.001), suggesting that activation of Wnt signaling triggers an increase in the number of cells in the deposited neuromast leading to growth of the neuromast following deposition. Scale bars: B′ = 10 μm; G = 20 μm. |

Az stimulates a persistent increase in proliferation of lateral line progenitors dependent on the canonical Wnt signaling pathway. A–C: Zebrafish were treated with DMSO or 2.5 μM Az beginning at 24 hpf, then given a 10-min pulse label of BrdU either at 48 or 96 hpf with fixation following 2 hr after BrdU-labeling. Images show BrdU labeling (red) or BrdU overlaid on DAPI (blue) labeling all nuclei. Dashed lines represent the extent of the neuromast. A: DMSO-treated zebrafish labeled with BrdU at 96 hpf show few dividing supporting cells. B: Az-treated zebrafish labeled with BrdU at 96 hpf show supporting cells throughout the neuromast labeled with BrdU. C: Quantification of the number of BrdU-positive cells in two anterior neuromasts from each of 7 fish treated with BrdU at either 48 or 96 hpf and fixed 2 hr later. Az stimulates more than twice as many dividing cells as DMSO-treated controls at both time-points (*P < 0.001). D–F: Inhibition of the canonical Wnt/β-catenin signaling pathways by heat-shock induction of dominant-negative TCF3 at 48 hpf suppresses the Az-induced increase in the number of proliferating progenitors at 72 hpf. Wild-type siblings that do not express the dominant negative transgene show the significant increase in the number of BrdU+ cells at 72 hpf induced by Az (D,F), but this increase is completely suppressed in fish expressing the transgene (E,F; *P < 0.001). G–I: Inhibition of supporting cell proliferation by the dkk1 transgene. Following heat shock, wildtype fish show normal levels of proliferation (G,I), but transgenic siblings expressing the dkk1 transgene have largely suppressed the proliferation of their supporting cells (H,I; *P < 0.001; t-test). Scale bars: B, E, H = 10 μm. |

Azakenpaullone triggers an increase in the number of hair cells differentiating in developing lateral line neuromasts. (A-B) Fish treated with 1-azakenapaullone beginning at 48 hpf show a dramatic increase in the size of the neuromast and in the number of HCS-1 positive hair cells at 7 dpf compared to DMSO-treated controls. (C) Quantification of the number of HCS-1 positive hair cells in an anterior neuromast from 7 fish treated with Az or DMSO beginning at 48 hpf. At both 4 dpf and 7 dpf, Az stimulated a significant increase in the number of differentiated hair cells, with more than twice as many hair cells produced by 7 dpf (*P < 0.01). (D-E) The increase in hair cell number can also be seen using the Brn3c:GFP transgenic line that express GFP in all of their hair cells. In all images, the dashed line represents the extent of the neuromast. Scale bar: 10 μm. |
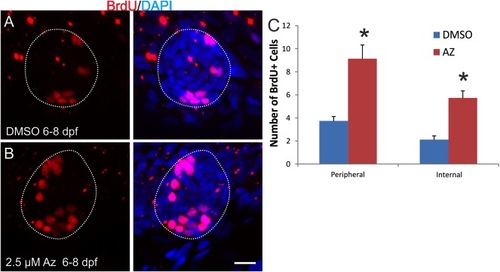
Az treatment triggers mature lateral line supporting cells to re-enter the cell cycle. Images show BrdU labeling (red) or BrdU overlaid on DAPI (blue) labeling all nuclei. Dashed lines represent the extent of the neuromast. A: Fish treated with DMSO from 6 to 8 dpf, with BrdU present continuously in the media, have few BrdU-positive proliferating cells in their neuromasts, as most supporting cells have become quiescent. B: Fish treated with 2.5 μM Az with BrdU present continuously from 6–8 dpf, show increased numbers of BrdU-positive proliferating cells throughout the neuromast. C: Quantification of BrdU-positive cells in neuromasts from DMSO-treated or Az-treated fish from 6–8 dpf, separating them by location either at the periphery of the neuromast or internal. Az stimulates a more than doubling in the number of proliferating cells, both among the peripheral and internal supporting cell populations. Scale bar = 10 μm. |
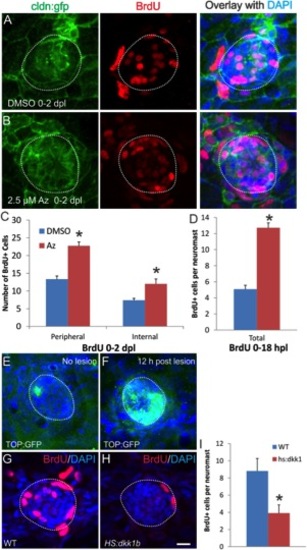
Wnt signaling controls regenerative proliferation in the lateral line neuromasts following hair cell lesion. A–D: Az stimulates an increase in the number of proliferative supporting cells following aminoglycoside lesioning of hair cells. Five-day-old fish were treated with 500 μM neomycin for 1 hr to kill the hair cells, then incubated in DMSO as a control (A) or 2.5 μM Az to stimulate Wnt signaling (B) with BrdU present continuously for 2 days post-lesion. C: Quantification of the number of BrdU-positive cells at 2 days post-lesion shows that Az led to a doubling in the number of dividing internal supporting cells and peripheral supporting cells (P < 0.001 for each; t-test). D: Quantification of BrdU-positive cells from DMSO-treated or Az-treated fish 18 hr after neomycin-induced lesion of the hair cells. Az again stimulated more than twice the number of BrdU+ cells compared to controls within 18 hr of the lesion. E,F: TOP:gfp expression shows upregulation of canonical Wnt cascade following neomycin-induced hair cell lesion. E: Six-dpf zebrafish not subject to neomycin shows little expression of the TOP:gfp transgene in neuromasts. F: Six-dpf zebrafish 12 hr after treatment with 500 μM neomycin shows upregulation of the TOP:gfp transgene, suggesting activation of the canonical Wnt pathway. G–I: Induction of the Wnt-inhibitory dkk1b in Tg(hsp70:dkk1b) zebrafish suppresses proliferation following neomycin-induced hair cell damage, with heat shock prior to the neomycin lesion and BrdU present from 0–18 hr following the lesion. G: Wildtype siblings show normal regenerative response 18 hr after lesion. H: In contrast, transgenic fish expressing dkk1b show few regenerating cells. I: The number of proliferating cells 18 hr after neomycin lesion is significantly lower in dkk1b-expressing fish than in wildtype controls (*P < 0.05; t-test). In all images, the dashed line shows the extent of the neuromast. Scale bar = 10 μm. |
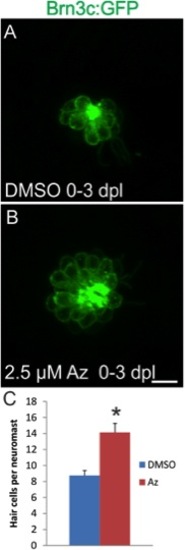
Az leads to a significant increase in the number of regenerated hair cells. Five-day-old Brn3c:gfp zebrafish were treated with 500 μM neomycin to kill hair cells, then incubated in DMSO (A) or Az (B) for 3 days following the lesion. C: DMSO-treated fish had 8.7 ± 0.6 GFP-positive hair cells per neuromast at 3 dpl, while Az-treated fish had 14.1 ± 1.1 GFP-positive hair cells, a significant increase (*P < 0.001; t-test). Scale bar = 10 μm. |