
- Title
-
TNF Dually Mediates Resistance and Susceptibility to Mycobacteria via Mitochondrial Reactive Oxygen Species
- Authors
- Roca, F.J., and Ramakrishnan, L.
- Source
- Full text @ Cell
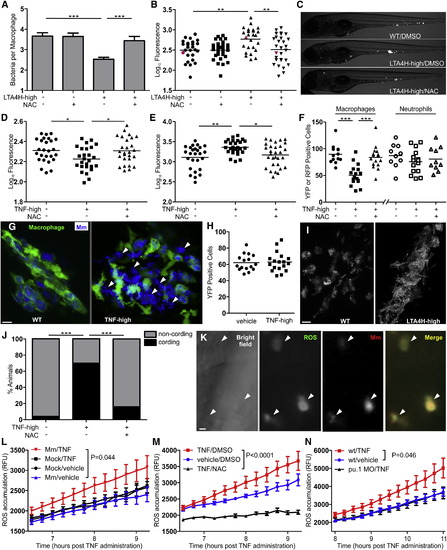
TNF-Mediated ROS Production Kills Both Mycobacteria and Infected Macrophages (A) Mean (±SEM) number of bacteria per infected macrophage in WT and LTA4H-high larvae in presence or absence of 40 μM NAC. ***p < 0.001 (one way ANOVA with Tukey’s posttest). (B) Bacterial burden (FPC) in WT and LTA4H-high siblings in presence or absence of 40 μM NAC. **p < 0.01 (one-way ANOVA with Tukey’s posttest). Representative of two independent experiments. (C) Representative fluorescence microscopy images of individual fish in (B) represented by red dots. (D) FPC of 1 dpi larvae injected with TNF or vehicle in the presence or absence of 40 μM NAC. p < 0.05 (one-way ANOVA with Tukey’s posttest). Representative of two independent experiments. (E) FPC 3 dpi of the same fish in (D). *p < 0.05; ***p < 0.01 (one-way ANOVA with Tukey’s posttest). Representative of two independent experiments. (F) Number of yellow fluorescent macrophages or red fluorescent neutrophils in 2 dpi fish one day after injection with TNF or vehicle in presence or absence of 40 μM NAC. ***p < 0.001 (one-way ANOVA with Tukey’s posttest). (G) Confocal microscopy of granulomas in 3 dpi Tg(mpeg1:YFP) larvae injected with TNF or vehicle. White arrowheads show extracellular bacteria. Scale bar, 10 μm. (H) Number of yellow fluorescent macrophages in Tg(mpeg1:YFP) uninfected fish 1 day postinjection with TNF or vehicle. Difference not significant by Student’s t test. Representative of two independent experiments. (I) Representative fluorescence microscopy images of 4 dpi WT and LTA4H-high larva. Scale bar, 10 μm. (J) Percentage of animals in (D) and (E) with cording 4 dpi. ***p < 0.001 (Fisher’s exact test). (K) Representative fluorescence microscopy images of 1 dpi LTA4H-high larvae 6 hr after incubation with CM-H2DCFDA. Arrowheads point to infected macrophages. Scale bar, 10 μm. (L) Quantification of ROS production as relative fluorescence units (RFU) (±SEM) in WT siblings infected with Mm or mock-infected (see Experimental Procedures) at the indicated time points after injection of TNF or vehicle. (two-way ANOVA). Representative of two independent experiments. (M) Quantification of ROS production as RFU (±SEM) in WT infected siblings at the indicated time points after injection of TNF or vehicle in presence or absence of 40 μM NAC. (two-way ANOVA). (N) Quantification of ROS production as RFU (±SEM) in infected WT or PU.1 morphant siblings at the indicated time points after injection of TNF or vehicle. (two-way ANOVA). (Also see Figures S1, S2, and S3). EXPRESSION / LABELING:
|

The TNF-RIP1-RIP3 Axis Mediates Necrosis of Infected Macrophages through Mitochondrial ROS Production (A) FPC in WT and LTA4H-high larvae in presence or absence of 10 μM Necrox-5. **p < 0.01 (one-way ANOVA with Tukey’s posttest). Representative of two independent experiments. (B) Percentage of animals in (A) with cording among WT and LTA4H-high larvae in presence or absence of 10 μM Necrox-5. *p < 0.05; ***p < 0.001 (Fisher’s exact test). (C) FPC in WT and LTA4H-high larvae injected with TNF or vehicle in presence or absence of 10 μM Necrox-5. *p < 0.05 (one-way ANOVA with Tukey’s posttest). (D) Percentage of animals in (C) with cording among WT and LTA4H-high larvae injected with TNF or vehicle in presence or absence of 10 μM Necrox-5. *p < 0.05 (Fisher’s exact test). (E) FPC in WT and LTA4H-high larvae in presence or absence of 10 μM Necrosulfonamide (NSA). **p < 0.01; ***p < 0.001 (one-way ANOVA with Tukey’s posttest). Representative of three independent experiments. (F) Mean (±SEM) number of bacteria per infected macrophage in WT and PGAM5 morphant siblings on WT or LTA4H-high background. ***p < 0.001 (one way ANOVA with Tukey’s posttest). Representative of two independent experiments. (G) FPC in WT and PGAM5 morphant siblings on WT or LTA4H-high background. ***p < 0.001 (one-way ANOVA with Tukey’s posttest). Representative of two independent experiments. (H) Percentage of animals in (G) with cording among WT and PGAM5 morphants on WT or LTA4H-high background. **p < 0.01 (Fisher’s exact test). (I–K) Confocal and bright field images of different infected macrophages in 1 dpi larvae 3 (I), 5 (J), or 6 (K) hr post-TNF injection. Scale bars, 1 μm. (Also see Figure S6). |
Reprinted from Cell, 153(3), Roca, F.J., and Ramakrishnan, L., TNF Dually Mediates Resistance and Susceptibility to Mycobacteria via Mitochondrial Reactive Oxygen Species, 521-34, Copyright (2013) with permission from Elsevier. Full text @ Cell