
- Title
-
Anteroposterior and dorsoventral patterning are coordinated by an identical patterning clock
- Authors
- Hashiguchi, M., and Mullins, M.C.
- Source
- Full text @ Development

Progressive DV neurectodermal patterning along the AP axis revealed by a Tg(hsp70:chd) BMP inhibition series. (A-F) six3, (G-L) otx2 and (M-R) gbx1 expression in anterior neurectoderm and (S-X) hoxb1b expression in posterior neurectoderm in non-heat shocked Tg(hsp70:chd) (WT) zebrafish embryos (A,G,M,S) and in Tg(hsp70:chd) embryos subject to heat shock (HS) at the indicated stages to inhibit BMP signaling (B-F,H-L,N-R,T-X). 1K-cell, 1000-cell stage. The DV width of the expression domain is indicated. Lateral views, dorsal to right, except for insets in A and B, which are animal pole views. (A-R) Shown at 80% epiboly stage; (S-X) shown at 90-95% epiboly stage. A, n=9/9; B, n=7/9; C, n=9/10; D, n=11/11; E, n=12/12; F, n=10/10; G, n=30/30; H, n=27/31; I, n=25/29; J, n=21/21; K, n=37/39; L, n=10/10; M, n=9/9; N, n=13/13; O, n=9/9; P, n=8/9; Q, n=9/10; R, n=10/10; S, n=32/32; T, n=26/27; U, n=21/22; V, n=28/29; W, n=17/20; X, n=20/21. |

Models of coordinate and independent DV and AP patterning, and anteriorization by FGF inhibition is patterned by BMP signaling with the same temporal dynamics as the normal domain. (A) Models in which DV and AP patterning are coordinated (model 1) or independent (model 2). Embryos are represented at late gastrula stage. The red dashed lines indicate the posteriorly expanded anterior tissue in the top panels and the anteriorly expanded posterior tissue in the bottom panels. (B-K) otx2 expression in anterior neurectoderm in non-heat shocked Tg(hsp70:chd) zebrafish embryos (WT) (B,G) and following HS at the indicated stages (C-F,H-K), with (G-K) or without (B-F) inhibition of FGF signaling by SU5402. The DV width and the AP length of otx2 expression are indicated by horizontal and vertical arrows, respectively. Lateral views, dorsal to right, at 80% epiboly. B, n=30/30; C, n=27/31; D, n=25/29; E, n=21/21; F, n=37/39; G, n=37/39; H, n=34/37; I, n=37/40; J, n=23/25; K, n=34/35. |
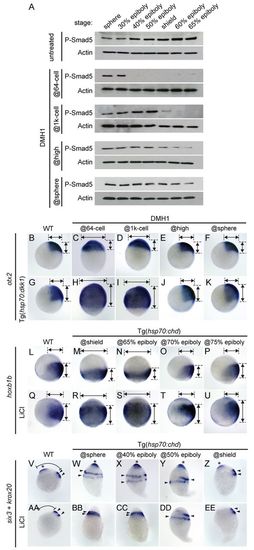
Temporal effectiveness of DMH1 in inhibiting P-Smad1/5, and the temporal patterning dynamics of DV tissues are unchanged when posteriorized or anteriorized by altered Wnt signaling. (A) P-Smad5 western blot for embryos collected at the indicated stages after treatment with the BMP signaling inhibitor DMH1 at the 64-cell, 1000-cell, high and sphere stages. Actin is a loading control. (B-K) Expression of otx2 in untreated wild type (B) and in wild type treated with DMH1 at the indicated stages (C-F). otx2 expression in HS Tg(hsp70:dkk1) embryos without (G) and with DMH1 treatment at the indicated stages (H-K). (L-U) Expression of hoxb1b in Tg(hsp70:chd) embryos not subject to HS (WT) (L,Q) and subject to HS at the indicated stages (M-P,R-U), without (L-P) and with (Q-U) LiCl treatment to activate Wnt signaling and posteriorize the embryos. (V-EE) Expression of six3 (asterisk) and krox20 (arrowheads) in wild type (V,AA) and in Tg(hsp70:chd) embryos subject to HS at the indicated stages (W-Z,BB-EE), without (V-Z) and with (AA-EE) LiCl treatment. The distance from the anterior tip of the head to the anterior boundary of r3 is indicated (V,AA). LiCl treatment was at shield stage. HS of Tg(hsp70:dkk1) embryos was performed at 37°C for 1 hour from 50% epiboly stage (5.3 hpf) to shield stage (6 hpf). Lateral views, dorsal to right. Embryos are shown at (B-K) 80% epiboly, (L-U) 90% epiboly and (V-EE) 6-somite stage. B, n=10/10; C, n=18/19; D, n=17/18; E, n=16/16; F, n=16/16; G, n=16/21; H, n=17/23; I, n=16/22; J, n=18/20; K, n=17/21; L, n=18/18; M, n=16/19; N, n=16/18; O, n=18/19; P, n=16/17; Q, n=9/13; R, n=10/15; S, n=16/18; T, n=18/20; U, n=17/19; V, n=23/23; W, n=18/19; X, n=16/18; Y, n=13/16; Z, n=19/19; AA, n=14/14; BB, n=14/14; CC, n=16/17; DD, n=16/18; EE, n=17/18. |

Posteriorly expanded hoxb1a and anteriorly expanded hoxb1b caused by altered RA signaling are patterned by BMP signaling with same temporal dynamics as the normal domains. (A-L) Expression of hoxb1a (bracket) in wild type (A,G) and in Tg(hsp70:chd) embryos subject to HS at the indicated stages (B-F,H-L), without (A-F) and with (G-L) DEAB treatment to inhibit RA signaling. (M-V) Expression of hoxb1b in wild type (M,R) and in Tg(hsp70:chd) embryos subject to HS at the indicated stages (N-Q,S-V), without (M-Q) and with (R-V) RA treatment. DEAB and RA treatments began at shield stage. Embryos are shown at (A-L) 6-somite and (M-V) 90% epiboly stages. Lateral views, dorsal to right. A, n=19/19; B, n=11/11; C, n=10/11; D, n=9/10; E, n=10/12; F, n=16/16; G, n=19/23; H, n=20/24; I, n=19/25; J, n=25/27; K, n=20/23; L, n=21/25; M, n=14/14; N, n=19/22; O, n=19/20; P, n=22/24; Q, n=24/24; R,=20/24; S, n=17/20; T, n=20/23; U, n=21/22; V, n=17/20. |
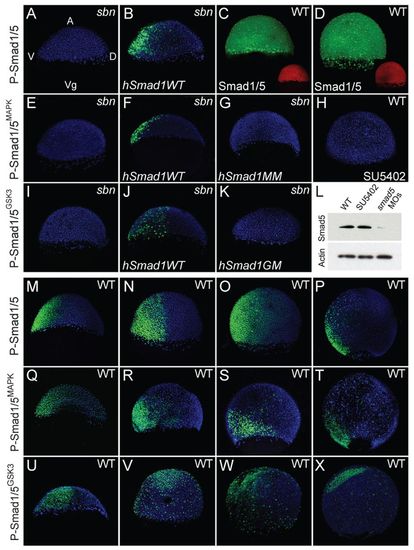
Localization of P-Smad1/5MAPK, P-Smad1/5GSK3 and total Smad1/5 during gastrulation. (A-K) Localization of P-Smad1/5 (A, n=4/4; B, n=5/6), total Smad1/5 (C, n=6/6; D, n=5/5), P-Smad1/5MAPK (E, n=5/5; F, n=4/5; G, n=3/3; H, n=7/7) and P-Smad1/5GSK3 (I, n=3/3; J, n=4/4; K, n=2/3) in sbndtc24 mutants (A,B,E-G,I-K) or wild type (C,D,H) at early gastrula stage (A-C,E-G,I-K), 75% epiboly (D) or 60% epiboly (H) stage. Embryos were injected with hSmad1WT (B,F,J), hSmad1MM (G) or hSmad1GM (K) RNA or were treated with SU5402 (H). (L) Western blot of total Smad5 protein in wild-type embryos and those treated with SU5402 or injected with smad5 MOs. Embryos were collected at 65% epiboly. Actin is a loading control. (M-X) Localization of P-Smad1/5 (M-P), P-Smad1/5MAPK (Q-T) and P-Smad1/5GSK3 (U-X) in wild type at shield (early gastrula) (M, n=8/8; Q, n=10/12; U, n=9/10), 70% epiboly (N, n=6/6; R, n=9/13; V, n=3/5), 80% epiboly (O, n=7/7; S, n=12/15; W, n=4/5) and 90% epiboly (late gastrula) (P, n=7/7; T, n=8/11; X, n=3/5) stage. All are merged confocal images of P-Smad1/5 (green), total Smad1/5 (green), P-Smad1/5MAPK (green), P-Smad1/5GSK3 (green) and DAPI (blue, except red in for C,D). Lateral views, dorsal to right. A, animal pole; Vg, vegetal pole; V, ventral; D, dorsal. |

Anteriorly expanded pax8, caused by activation of RA signaling, is patterned by BMP signaling with the same temporal dynamics as the normal posterior domain. (A-E) Expression of pax8 (arrowheads) in wild type (A, n=42/42) and in Tg(hsp70:chd) heat shocked at sphere (B, n=38/38), 40% epiboly (C, n=28/31), 50% epiboly (D, n=31/35) and shield (E, n=30/31) stage. (F-J) pax8 expression in RA-treated wild type (F, n=38/39) and RA-treated and heat shocked Tg(hsp70:chd) at sphere (G, n=30/30), 40% epiboly (H, n=31/35), 50% epiboly (I, n=32/34) and shield (J, n=37/38) stage. Lateral views, dorsal to right with anterior to top, except for insets in A and F, which are dorsal views with anterior to top. All are at the 6-somite stage. |

hSmad1WT and hSmad1MM mRNAs similarly rescue Smad5-deficient dorsalized embryos and hSmad1WT and hSmad1MM are equally stable in the injected embryos. (A) Percentage of embryos that show severely (C5), moderately (C3) and mildly (C1/C2) dorsalized, wild-type (WT) and V1 (diminished eye size and increased ventral tail fin tissue) phenotypes in control and smad5 MO-injected Tg(hsp70:chd) embryos without heat shock, also injected with either hSmad1WT mRNA (250, 350 or 450 pg) or hSmad1MM mRNA (250, 350 or 450 pg). (B) Western blot for total Smad1/5 protein in the same embryos as shown in A. Embryos were collected at 80% epiboly stage. Control and smad5 MO-injected Tg(hsp70:chd) embryos, also injected with hSmad1WT mRNA (250, 350 or 450 pg) and hSmad1MM mRNA (250, 350 or 450 pg), and either not heat shocked (noHS; upper left panel) or heatshocked at 60% epiboly (upper right), 65% epiboly (lower left) or 70% epiboly (lower right). |