
- Title
-
Specification of posterior hypothalamic neurons requires coordinated activities of Fezf2, Otp, Sim1a and Foxb1.2
- Authors
- Wolf, A., and Ryu, S.
- Source
- Full text @ Development

Otp regulates the expression of fezf2 and foxb1.2 in the putative mammillary area. Whole-mount in situ hybridization (WISH) to detect the expression of fezf2 and foxb1.2 in 2-dpf wild-type (A,C,E) and otpam866 mutant zebrafish embryos injected with 4 ng otpb morpholino (MO) (B,D,F). (A-D) In embryos lacking Otp activity, the fezf2 expression domain is strongly reduced in the PO (arrows) and expanded in the posterior part of the hypothalamus (brackets; C and D are more dorsal planes to A and B in the same embryo; n=11/11). (E,F) In embryos lacking Otp activity, foxb1.2 expression is expanded in the putative mammillary area (MA) (arrowheads; n=17/17). Dorsal views are shown. PO, preoptic area; Hyp, hypothalamus; LOF, loss-of-function. Scale bar: 100 μm. EXPRESSION / LABELING:
|

Fezf2 is important for early development of the posterior hypothalamus. (A-E′′ ′) Three-color fluorescent whole-mount in situ hybridization (FISH) of 1-dpf wild-type zebrafish embryos with probes for nkx2.1a, shh, emx2, fezf2, foxb1.2 and otpb. Maximum projections of 10 7mu;m confocal stacks are shown. (A-A′′ ′) The hypothalamic expression domains of fezf2 and foxb1.2 are within the posterior part of the nkx2.1a expression domain. (B-B′′ ′) fezf2 expression in the posterior hypothalamus and shh expression in the anterior hypothalamus do not overlap, whereas foxb1.2 is partially co-expressed with fezf2 and shh. (C-C′′ ′) emx2 is expressed in the posterior-ventral hypothalamus within the fezf2 domain, slightly overlapping with foxb1.2. (D-E′′ ′) The posterior hypothalamic otpb domain is contained within the nkx2.1a and foxb1.2 domain and is also fezf2 positive. emx2 in E is smaller than in C3, as E represents a more lateral plane than C′′. The white dashed lines delineate the hypothalamus as defined by nkx2.1a expression; solid white lines outline the different expression domains. (F-M) WISH at 1 dpf on uninjected (F,H,J,L) and 4 ng fezf2 MO-injected (G,I,K,M) embryos reveals that the emx2 expression domain in the posterior-ventral hypothalamus is severely reduced in fezf2 morphants (arrowheads in F,G), whereas the foxb1.2 expression domain is not reduced (H,I). Reduction in prethalamus is apparent in fezf2 morphants (double-headed arrows in F-I). The black dashed lines delineate the telencephalon-diencephalon border. (J-M) fezf2 morphants show an expansion in the posterior hypothalamic domains of wnt8b and fgf8 (double-headed arrows in J-M). (N,O) Summaries of co-expression of the transcription factors in wild type (N) and in fezf2 morphants (O). Lateral views are shown. Tel, telencephalon; Hyp, hypothalamus; HB, hindbrain; LOF, loss-of-function. Scale bars: 60 μm in A-E′′ 100 μm in F-M. |
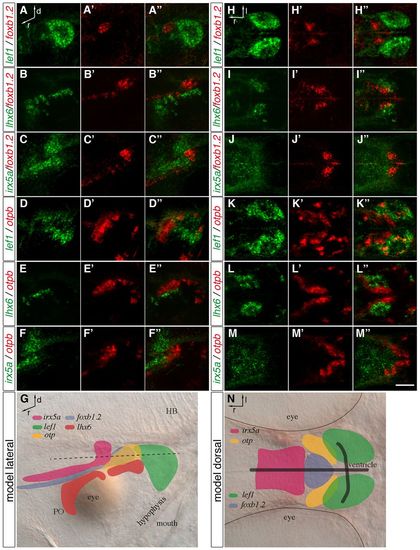
Distinct MA domains are present at 2 dpf. (A-F′′,H-M′′) Two-color FISH of 2-dpf wild-type zebrafish embryos with probes detecting foxb1.2, otpb, lef1, lhx6 and irx5a expression. Maximum projections of up to 40 μm confocal stacks are shown in lateral (A-F′′) and dorsal (H-M′′) view. (A-A′′,D-′′3,H-H′′,K-K′′) The lef1 expression domain is positioned posterior to foxb1.2 and otpb, slightly overlapping with otpb expression. (B-B′′,E-E′′,I-I′′,L-L′′) lhx6 is expressed ventral and lateral to the foxb1.2 and otpb domain. (C-C′,F-F′′,J-J′′,M-M′′) irx5a expression is found anterior and dorsal to foxb1.2 and otpb expression. (G,N) Representation of the transcription factor expression domains in lateral (G) and dorsal (N) view. The black dashed line (G) indicates the plane of the expression domains shown in the dorsal view. Black lines in N indicate the position of the ventricle. PO, preoptic area; HB, hindbrain; d, dorsal; l, lateral; r, rostral. Scale bar: 60 μm. EXPRESSION / LABELING:
|
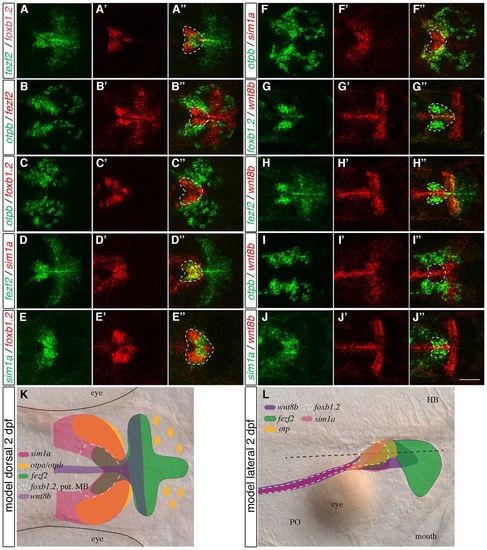
The expression of foxb1.2, fezf2, otpb, sim1a and wnt8b in the MA. (A-J′′) Two-color FISH of 2-dpf wild-type zebrafish embryos with probes for otpb, sim1a, fezf2, foxb1.2 and wnt8b reveals their relative expression patterns in the MA. (A-A′′) Strong foxb1.2 expression marks the putative mammillary body (MB) where fezf2 expression partially overlaps but extends further posterior. (B-C′′) By contrast, otpb is expressed laterally and adjacent to fezf2 (B-B′′) and foxb1.2 (C-C′′). (D-D′′) fezf2 and sim1a are partially co-expressed in the putative MB. (E-E′′) sim1a partially overlaps with foxb1.2. (F-F′′) Lateral to the putative MB, sim1a is co-expressed with otpb. (G-J′′) wnt8b is expressed in the midline and in a domain posterior to the putative MB (G-G3) and is partially co-expressed with fezf2 (H-H′′), otpb (I-I′′) and sim1a (J-J′′). (K) Summary of the relative expression domains of foxb1.2, sim1a, otp, fezf2 and wnt8b in the dorsal view. The white dashed lines demarcate the putative MB. (L) Representation of the relative expression domains of foxb1.2, sim1a, otp, fezf2 and wnt8b in the lateral view. Dorsal views of maximum projections of 10-15 μm confocal stacks are shown. Scale bar: 60 μm. EXPRESSION / LABELING:
|
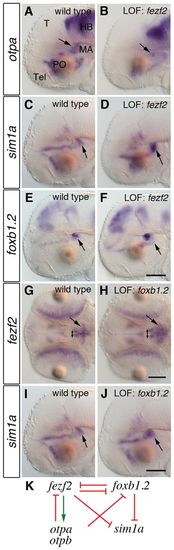
Genetic interactions among fezf2, otp, sim1a and foxb1.2. (A-J) WISH of 2-dpf wild-type zebrafish embryos (A,C,E,G,I) and embryos injected with 4 ng fezf2 MO (B,D,F) or 8 ng foxb1.2 MO (H,J) to detect changes in the expression of otpa, sim1a, foxb1.2 and fezf2. Lateral (A-F,I,J) and dorsal (G,H) views are shown. (A,B) The expression of otpa is reduced in the MA in fezf2 morphants (B, arrows; n=11/14). (C,D) In the MA, sim1a is expanded in fezf2 morphants (D, arrow; n=19/19). (E,F) The loss of Fezf2 activity results in an expansion of the foxb1.2 domain (F, arrows; n=32/32). (G,H) The expression of fezf2 in foxb1.2 morphants is expanded in the anterior (double-headed arrows) and posterior MA (H, arrows; n=19/25). (I,J) Also the expression of sim1a in foxb1.2 morphants is expanded (J, arrow; n=12/12). The same wild-type image is shown in C and I for the purposes of direct side-by-side comparison with morphants; the in situs for C/I, D and J were all conducted in parallel. (K) Summary of the observed genetic interactions. T, tectum; Tel, telencephalon; PO, preoptic area; MA, mammillary area; HB, hindbrain; LOF, loss-of-function. Scale bar: 100 μm. EXPRESSION / LABELING:
|
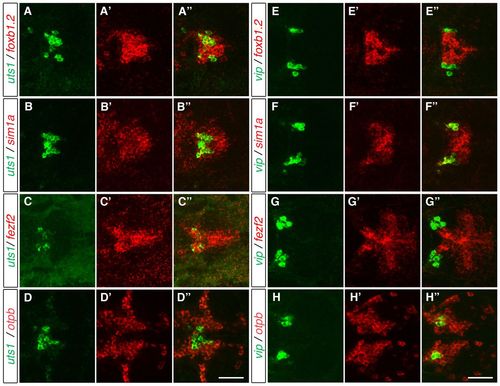
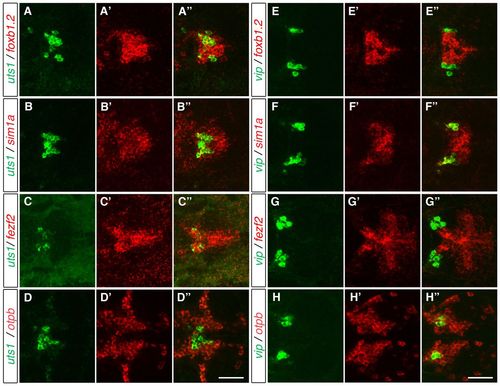
Vip- and Uts1-positive neurons develop within different MA domains. (A-H′′) Two-color FISH of 3-dpf (A-D′′) and 2-dpf (E-H′′) wild-type zebrafish embryos to detect the relative expression of vip, uts1, otpb, sim1a, fezf2 and foxb1.2 in the MA. uts1 is co-expressed with foxb1.2 (A-A′′), sim1a (B-B′′) and fezf2 (C-C′′) but not with otpb (D-D′′). By contrast, vip is not co-expressed with foxb1.2 (E-E′′) and fezf2 (G-G′′), whereas it is co-expressed with sim1a (F-F′′) and otpb (H-H′′). Maximum projections of 10-15 μm confocal stacks in the dorsal view are shown. Scale bar: 60 μm. EXPRESSION / LABELING:
|

Transcription factor requirements and sufficiency for Vip- and Uts1-positive neuron specification. (A-L) vip and uts1 WISH at 2 dpf (A-F) and 3 dpf (G-L) in wild-type zebrafish embryos (A,G), otpam866 mutant embryos injected with 4 ng otpb MO (B,H) and wild-type embryos injected with 1 ng sim1a MO (C,I), 4 ng fezf2 MO (D,J), 4 ng fezf2 MO caged with PhotoMorph (PM) until 1 or 2 dpf (E,K) and 8 ng foxb1.2 MO (F,L). Dorsal (A-F) and lateral (G-L) views are shown. (A-F) vip expression in the MA (arrowheads) is reduced in embryos with loss of Otp (B; n=19/19), Sim1a (C; n=30/53) and Fezf2 (D; n=37/39) activity. (E) Embryos with fezf2 PM uncaged at 1 dpf (n=60/60) and foxb1.2 morphants (F; n=20/20) show no changes in vip expression. (G-L) The expression of uts1 in the MA (arrows) is upregulated in embryos that lack Otp function (H; n=21/21) whereas it is downregulated in sim1a (I; n=29/42) and in fezf2 (J; n=17/42) morphants. (K) Uncaging of the fezf2 PM at 2 dpf resulted in a reduction of uts1 expression (n=32/57). (L) The loss of Foxb1.2 function leads to an expansion of the uts1-positive cells (n=58/76). (M-P) Percentage change in the number of Vip-positive (M,O) and Uts1-positive (N,P) neurons in loss-of-function embryos compared with uninjected wild-type embryos (M,N) and in transgenic embryos overexpressing cDNAs for otpa, sim1a, fezf2 or foxb1.2 compared with heat shocked wild-type embryos (O,P). Cell number changes were compared with the theoretical median cell number of wild-type embryos and analyzed using the Wilcoxon signed rank test. At 2 dpf, the number of Vip-positive cells in wild-type embryos has median and mean (±s.e.m.) values of 14 and 14.6±0.36, respectively. (M) The loss of Otp, Sim1a and Fezf2 function leads to a reduction in VIP cell number in the MA compared with wild-type embryos, whereas the uncaged fezf2 PM and the foxb1.2 morphants show no difference compared with the wild type (P=0.0812 and P=0.7423, respectively). (N) The number of Uts1-positive cells in wild-type embryos has median and mean values of 8 and 8.5±0.22, respectively. Embryos lacking Otp and Foxb1.2 activity have an increased number of Uts1-positive cells, whereas the loss of Sim1a, Fezf2 and the uncaged fezf2 PM leads to a reduction. (O,P) Heat shocked wild-type embryos have median and mean values of 13 and 12.8±0.17 Vip-positive cells, respectively. (O) Overexpression of Otpa and Sim1a leads to a higher number of Vip-positive cells. Combined overexpression of Otpa and Sim1a also leads to a higher number of Vip-positive cells, whereas overexpression of Foxb1.2 results in a lower number of Vip-positive cells. Overexpression of Fezf2 led to no change in the number of Vip-positive cells (P=0.2170). (P) The number of Uts1-positive cells in heat shocked wild-type embryos has median and mean values of 9 and 8.8±0.19, respectively. Overexpression of Fezf2, a combination of Fezf2 and Sim1a, and Foxb1.2 leads to a higher number of Uts1-positive cells at 3 dpf in the MA compared with the wild type, whereas overexpression of Sim1a showed no change in the number of Uts1-positive cells (P=0.5645). *P<0.05, **P<0.01, ***P<0.001; error bars indicate s.e.m. The number of embryos analyzed is shown alongside each bar. T, tectum; Tel, telencephalon; PO, preoptic area; MA, mammillary area; HB, hindbrain; LOF, loss-of-function; GOF, gain-of-function; PM, PhotoMorph. Scale bar: 100 μm. EXPRESSION / LABELING:
|

The tuberal hypothalamus is ventral to the mammillary area. (A-B-′′′ ′) Three-color FISH detecting the expression of pomca, fezf2, dlx2a, nr5a1a and foxb1.2 in 2-dpf wild-type embryos with DIC (A-′′′ ′,B-′′′ ′). (A-A-′′′ ′) The hypothalamic expression of pomca (arrows) is anterior to its adenohypophyseal expression (arrowheads) and ventral to the mammillary fezf2 signal. dlx2a is expressed between the tuberal hypothalamic and adenohypophyseal pomca expression domains. (B-B-′′′ ′) nr5a1a expression (arrows) is ventral to the foxb1.2 expression. (C) Scheme showing relative expression of the marker genes to distinguish between tuberal and mammillary regions. Lateral views of maximum projections of 10 μm confocal z-stacks are shown. Tel, telencephalon; HB, hindbrain; PO, preoptic area; tuberal hyp, tuberal hypothalamus; adenohyp, adenohypophysis. Scale bar: 100 μm. |
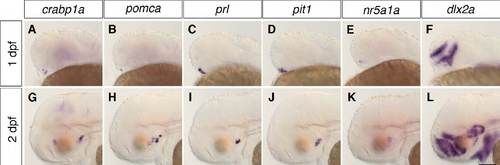
Location of adenohypophysis/neurohypophysis and tuberal hypothalamus in zebrafish embryos. WISH of 1-dpf (A-F) and 2-dpf (G-L) wild-type embryos to detect the expression of crabp1a, pomca, prl and pit1 to identify adenohypophysis/ neurohypophysis and nr5a1a and dlx2a to identify the putative tuberal hypothalamic area. Lateral views. Scale bar: 100 μm. |
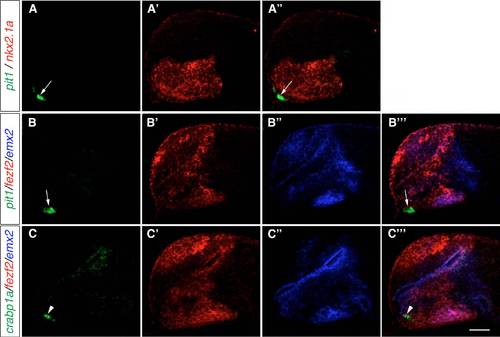
Adenohypophysis markers are not expressed in the hypothalamus at 1 dpf. Three-color FISH of 1-dpf wild-type embryos to detect the expression of pit1, crabp1a, prl, nkx2.1a, fezf2 and emx2. (A-B-′′′) pit1 (arrows) is not co-expressed with nkx2.1a ( |
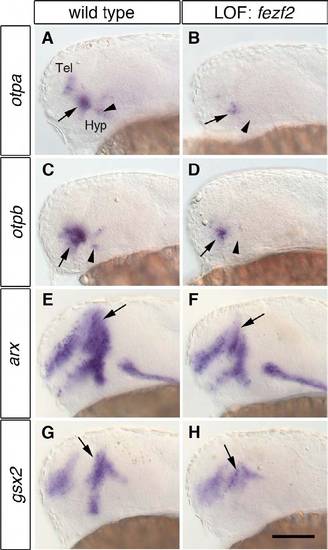
otp and the prethalamic markers arx and gsx2 are severely reduced in fezf2 morphants. One-dpf wild-type embryos (A,C,E,G) and embryos injected with 4 ng fezf2 MO (B,D,F,H) were subjected to WISH to detect changes in the expression of otpa, otpb, arx and gsx2. (A-D) fezf2 morphants display a strong reduction in otpa (B; n=27/29) and otpb (D; n=24/24) in the anterior diencephalic expression (arrows) and a loss in the posterior diencephalic expression domain (arrowheads). (E-H) The expression of arx (E,F, arrows; n=25/25) and gsx2 (G,H, arrows; n=28/28) is reduced in the prethalamus. Lateral views are shown. Tel, telencephalon; Hyp, hypothalamus; LOF, loss-of-function. Scale bar: 100 μm. |

Reduction of wnt8b affects emx2 expression in the posterior-ventral hypothalamus. (A-I) WISH of 1-dpf wild-type embryos (A,D,G) and embryos injected with 3 ng wnt8b MO (B,E,H) or 2.5 ng fgf8 MO (C,F,I) with probes for emx2, nkx2.1a and shh shows that loss of wnt8b affects emx2 expression. (A-C) emx2 expression is reduced in the posterior-ventral hypothalamus in wnt8b morphants (B, arrowhead; n=19/19) but is not changed in fgf8 morphants (C; n=18/18). (D-F) Neither wnt8b (E; n=17/17) nor fgf8 (F; n=19/19) morphants show changes in nkx2.1a expression. Also, the expression of shh is unchanged upon loss of wnt8b (H; n=24/24) or fgf8 (I; n=18/18). (J) One-dpf wild-type embryos subjected to two-color FISH to analyze the relative hypothalamic domain sizes of emx2 and nkx2.1a using ImageJ. (K) The ratio of the nkx2.1a expression domain to the hypothalamic emx2 expression domain is unchanged in fgf8 morphants. The number of analyzed embryos is indicated within the bars. P=0.2483 (Student’s t-test); n.s., not significant. Lateral views are shown. Tel, telencephalon; Hyp, hypothalamus; LOF, loss-of-function. Scale bars: 100 μm in A-I; 60 μm in J. |
The hypothalamic fgf8 expression domain is expanded in embryos lacking fezf2 activity. (A-B′′) Two-color FISH to detect the relative expression of fgf8 and nkx2.1a in 1-dpf wild-type embryos (A-A′′) and fezf2 morphants (B-B′′). fgf8 is co-expressed with nkx2.1a (arrows) and the hypothalamic expression domain of fgf8 is expanded in embryos lacking fezf2 activity (B-B′′). Maximum projections of 10 μm confocal stacks in the lateral view are shown. LOF, loss-of-function. Scale bar: 60 μm. |
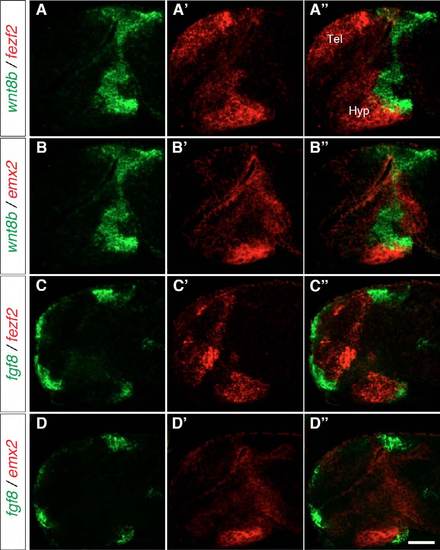
wnt8b and fgf8 expression mostly does not overlap with emx2 expression. Two-color FISH of 1-dpf wild-type embryos to detect the relative expression domains of wnt8b, fgf8, fezf2 and emx2. (A-A′′) wnt8b and fezf2 are expressed in adjacent domains in the posterior-dorsal hypothalamus. (B-B′′) emx2 and wnt8b expression mostly do not overlap with each other. (C-D′′) Whereas fezf2 and fgf8 are mainly co-expressed in the posterior-ventral hypothalamus (C-C′′), fgf8 and emx2 are mainly not co-expressed (D-D′′). Lateral views of 10 μm maximum projections of confocal z-stacks are shown. Tel, telencephalon; Hyp, hypothalamus. Scale bar: 60 μm. |
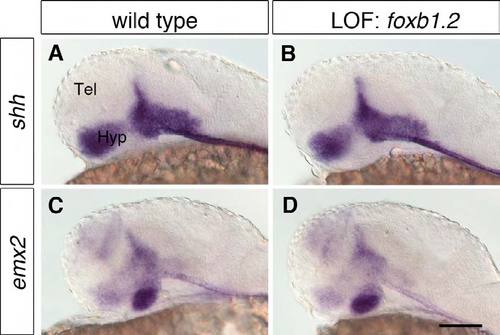
Foxb1.2 plays no apparent role in hypothalamus regionalization. (A-D) WISH of 1-dpf wild-type embryos (A,C) and embryos injected with 8 ng foxb1.2 MO (B,D) with probes for the hypothalamic regionalization markers shh and emx2 shows that Foxb1.2 does not control their expression. The loss of Foxb1.2 function does not lead to apparent changes in the expression of shh (B; n=27/27) nor emx2 (D; n<./em>=22/22). Lateral views are shown. Tel, telencephalon; Hyp, hypothalamus; LOF, loss-of-function. Scale bar: 100 μm. |
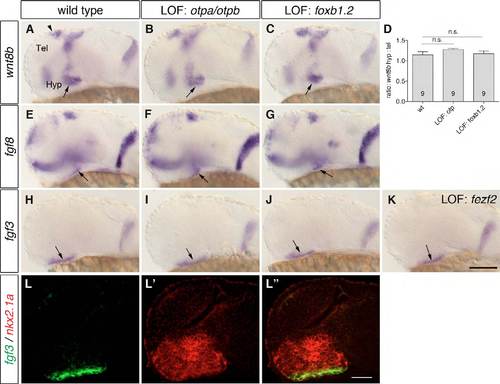
Posterior hypothalamic wnt8b, fgf8 and fgf3 expression domains are present in embryos that lack Otp or Foxb1.2 activity. (A-C,E-K) One-dpf wild-type embryos (A,E,H), otpam866 embryos injected with 4 ng otpb MO (B,F,I), embryos injected with 8 ng foxb1.2 MO (C,G,J) and with 4 ng fezf2 MO (K) were subjected to WISH to detect the expression of wnt8b, fgf8 and fgf3. (A-C) The wnt8b expression domain in the posterior hypothalamus (arrows) is not changed in embryos that lack Otp (B; n=15/15) or Foxb1.2 (C; n=35/35). (E-G) The fgf8 expression domain in the posterior hypothalamus (arrows) is still present in embryos that lack Otp (F; n=12/12) or Foxb1.2 (G; n=34/34) function. (H-K) The fgf3 expression domain (arrows) is found in embryos with reduced Otp (I; n=8/8), Foxb1.2 (J; n=54/54) or Fezf2 activity (K; n=59/59). (D) The ratio of the hypothalamic (arrows) to the telencephalic (arrowhead) wnt8b expression domains (using ImageJ). The number of analyzed embryos is indicated within the bars. P=0.1364, P=0.7639 (Student’s t-test); n.s., not significant. (L-L0) Whole-mount two-color FISH to detect the expression of fgf3 and nkx2.1a in 1-dpf wild-type embryos. fgf3 is co-expressed with the hypothalamic nkx2.1a. Lateral views are shown. Tel, telencephalon; Hyp, hypothalamus; LOF, loss-of-function. Scale bar: 100 μm in A-C,E-K; 60 μm in L-L′′. |
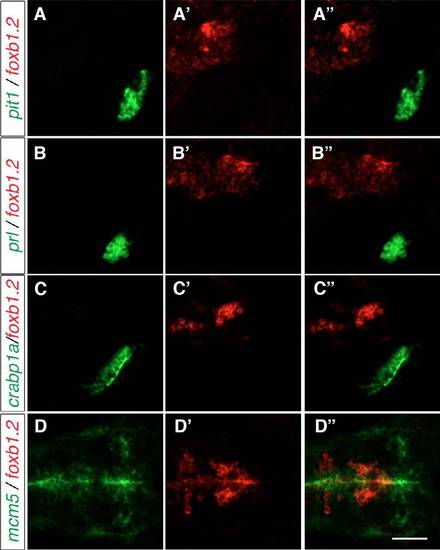
The expression of hypophysis markers and mcm5 relative to the foxb1.2 expression domain. Two-color FISH of 2-dpf wild-type embryos to detect the expression of pit1, foxb1.2, prl, crabp1a and mcm5. (A-C′′) Neither of the adenohypophysis markers pit1 and prl nor the neurohypophysis marker crabp1a are expressed in the same region as foxb1.2. (D-D′′) mcm5 expression marks the proliferation zone lining the ventricles and is partially co-expressed with foxb1.2. Lateral views from maximum projections of 10 μm confocal stacks are shown in A-C′′, whereas dorsal views of maximum projections of confocal stacks of 15 μm are shown in D-D′′. Scale bar: 60 μm. |

DIC images allow the identification of landmarks useful for generating a summary scheme for marker gene expression domains. (A-B-′′ ′) Two-color FISH with probes for lhx6 and otpb on 2-dpf wild-type embryos together with DIC image (A′′,B′′) in dorsal (A-A-′′ ′) and lateral (B-B-′′ ′) view, as an example to illustrate how DIC images can be combined with FISH images. Maximum projections of 10 μm confocal stacks are shown. Scale bar: 60 μm. |
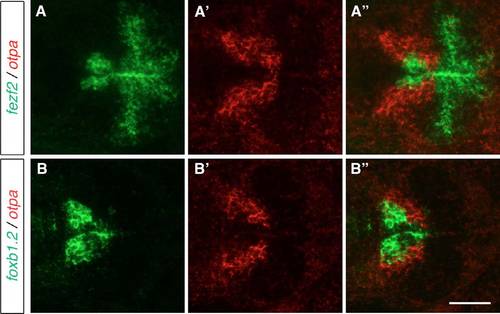
otpa is expressed lateral to the putative MB. Two-color FISH of 2-dpf wild-type embryos to detect the expression of otpa relative to the expression of fezf2 and foxb1.2. otpa is expressed lateral to the putative MB, adjacent to the expression domains of (AA′′) fezf2 and (B-B′′) foxb1.2. Maximum projections of 10-15 μm confocal stacks are shown in dorsal view. Scale bar: 60 μm. |
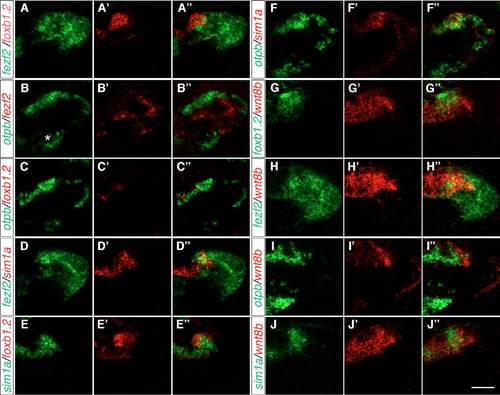
The expression of foxb1.2, otp, fezf2, sim1a and wnt8b in the MA. Two-color FISH of 2-dpf wild-type embryos to detect the expression of otpb, sim1a, fezf2, foxb1.2 and wnt8b in the MA in lateral views. (A-A′′) The expression of foxb1.2 partially overlaps with that of fezf2, which extends more posterior and ventral. (B-C′′) By contrast, otpb is expressed dorsally and adjacent to fezf2 expression in the MA (B-B′′), whereas foxb1.2 is more medial to otpb expression (C-C′′). otpb is also expressed in the ventral hypothalamus (asterisk in B), but this expression domain in not included in our summary model for the sake of simplicity. (D-D′′) fezf2 and sim1a partially overlap in the anteriormost part of the dorsal fezf2 expression domain. (E-E′′) foxb1.2 is partially co-expressed with sim1a. (F-J0) otpb and sim1a are mainly co-expressed (F-F′′), whereas wnt8b and foxb1.2, fezf2, otpb or sim1a only partially overlap ( |
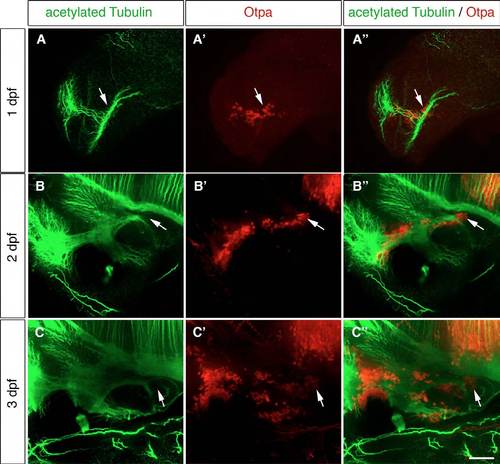
Axon tracts are present in the posterior hypothalamic area. (A-C′′) Immunohistochemistry (IHC) of 1-dpf (A-A′′), 2-dpf (B-B′′) and 3-dpf (C-C′′) wild-type embryos using antibodies detecting acetylated tubulin (A,B,C) and Otpa (A′′ ′,B′′ ′,C′′ ′). Maximum projections of up to 25 μm stacks in the lateral view are shown. The white arrows point to the Otpa-positive MA. (A-A′′) At 1 dpf the posterior Otpa-positive domain is located near dense axon tracts. (B-C′′) Also at 2 and 3 dpf, axon tracts are found in the Otpa-positive MA. ac, anterior commissure (ac); MA, mammillary area. Scale bar: 60 μm. |

Fezf2 activity from 1 dpf onwards regulates foxb1.2 and sim1a expression in the MA. WISH of 2-dpf wild-type (A,D,G) embryos injected with 4 ng fezf2 MO (B,E,H) and embryos injected with 4 ng caged fezf2 MO and uncaged at 1 dpf (C,F,I) to detect the expression of foxb1.2, otpa and sim1a. Dorsal views (A-C,G-I) and lateral views (D-F) are shown. (A-C) Both fezf2 morphants (B; n=32/32) and uncaged fezf2 PM at 1 dpf (C; n=16/20) show an expanded foxb1.2 expression domain (double-headed arrows). (D-F) Whereas the loss of Fezf2 activity early on results in a severe reduction of otpa in the MA (E, arrow; n=11/14), reduced Fezf2 activity from 1 dpf onward leads to no apparent changes in otpa expression (F; n=18/18). (G-I) The expression of sim1a is expanded in fezf2 morphants (H, double-headed arrows; n=19/19) as well as in uncaged fezf2 PM embryos (I, double-headed arrows; n=16/26). Doubleheaded arrows indicate the extent of the expression domains relative to the eye. T, tectum; Tel, telencephalon; Hyp, hypothalamus; LOF, loss-of-function; PO, preoptic area; HB, hindbrain; MA, mammillary area. Scale bar: 100 μm. |
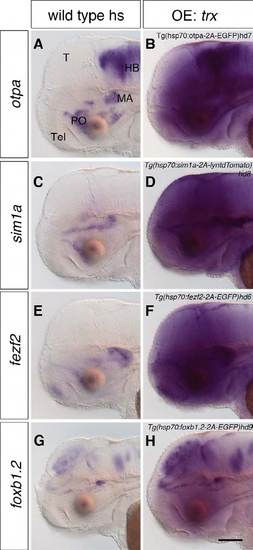
Heat shock induces overexpression of the transgenes. (A-H) After an overnight heat shock, 2-dpf wild-type embryos (A,C,E,G) and embryos containing Tg(hsp70:otpa-2A-EGFP)hd7 (B), Tg(hsp70:sim1a-2A-lyntdTomato)hd8 (D), Tg(hsp70:fezf2-2AEGFP) hd6 (F) and Tg(hsp70:foxb1.2-2A-EGFP)hd9 (H) were subjected to WISH to detect the overexpression of otpa, sim1a, fezf2 and foxb1.2. Transgenic embryos expressing otpa (B; n=24/24), sim1a (D; n=29/29), fezf2 (F; n=37/37) and foxb1.2 (H; n=34/34) show overexpression of the specific transgenes. Lateral views are shown. hs, heat shock; OE, overexpression. Scale bar: 100 μm. |
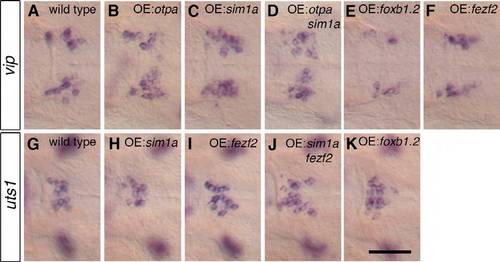
Otpa and Sim1a are sufficient to induce supernumerary VIP neurons and Fezf2 and Foxb1.2 are sufficient to induce supernumerary Uts1 neurons. After an overnight heat shock, 2-dpf and 3-dpf wild-type embryos (A,G) and embryos containing Tg(hsp70:otpa-2A-EGFP)hd7 (B), Tg(hsp70:sim1a-2A-lyntdTomato)hd8 (C,H), Tg(hsp70:otpa-2A-EGFP)hd7; Tg(hsp70:sim1a- 2A-lyntdTomato)hd8 (D), Tg(hsp70:foxb1.2-2A-EGFP)hd9 (E,K), Tg(hsp70:fezf2-2A-EGFP)hd6 (F,I) and Tg(hsp70:sim1a-2AlyntdTomato) hd8; Tg(hsp70:fezf2-2A-EGFP)hd6 (J) were subjected to WISH to detect the expression of vip and uts1. (A-F) The overexpression of otpa (B; n=62/100), sim1a (C; n=75/129) and the combined overexpression of both (D; n=22/31) leads to supernumerary vip-expressing cells, whereas the overexpression of foxb1.2 (E; n=79/93) results in fewer vip-expressing cells and overexpression of fezf2 has no effect (F; n=105/105). (G-K) The overexpression of sim1a (H; n=152/152) results in no changes in uts1 cell number, whereas the overexpression of fezf2 (I; n=87/158), a combination of sim1a and fezf2 (J; n=25/47) and foxb1.2 (K; n=95/129) results in supernumerary uts1-expressing cells. Magnified dorsal views are shown. OE, overexpression. Scale bar: 50 μm. |