
- Title
-
Opa1 is required for proper mitochondrial metabolism in early development
- Authors
- Rahn, J.J., Stackley, K.D., and Chan, S.S.
- Source
- Full text @ PLoS One

Western blot analysis. |
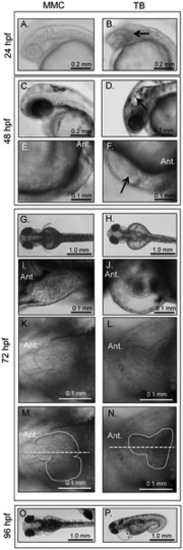
Phenotypic analyses of MMC (A, C, E, G, I, K, M, O) and TB (B, D, F, H, J, L, N, P) morphant embryos and larvae. |

Eye area and heart rate analyses for MMC (black) and Opa1 morphants (grey). A. Eye area was measured by tracing the circumference of individual eyes using AxioVision software. N = 9–12. *p-value <0.05, **p-value <0.01 by Student′s 2-tailed t-test. B. Heart rates were measured by counting beats per min for individuals injected with MMC or TB morpholino. N = 34 (48 hpf), n = 44 (72 hpf). *p-value <0.01 by Student′s 2-tailed t-test. PHENOTYPE:
|
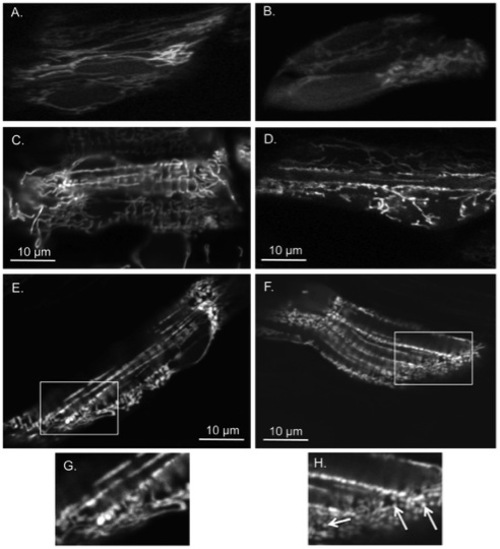
Opa1 morphants have more fragmented mitochondria and disorganized fibers when compared to MMC morphants.Cells from MMC morphants at 24 hpf (A), 48 hpf (C), 72 hpf (E) are compared to similar regions in Opa1 morphants at 24 hpf (B), 48 hpf (D), 72 hpf (F). (A-B) obtained with multiphoton confocal microscopy 400x with 3.8-4.0x zoom and (C-F) with single photon confocal microscopy 400x with 4.0x zoom. (A-B) cells within the eye, (C-F) skeletal myocytes. (G) and (H) are enlargements of boxed areas in (E) and (F) respectively. Note abnormal mitochondrial morphology in (H) as denoted by arrows. PHENOTYPE:
|
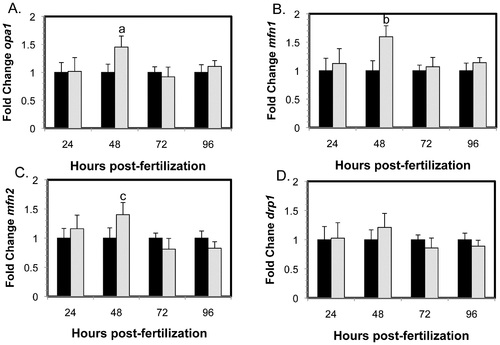
Gene expression changes of mitochondrial morphology genes in MMC morphants (black) and Opa1 morphants (grey) normalized to MMC morphant levels. Significant increases in gene expression of mitochondrial fusion proteins (A) opa1 (a, p = 0.003), (B) mfn1 (b, p = 0.001) and (C) mfn2 (c, p = 0.01) were observed in Opa1 morphants compared to MMC morphants. No differences were observed for (D) drp1, a mitochondrial fission protein. Error bars are shown +/- SEM, n = 5. P-values obtained by ANOVA. |

Gene expression changes in MMC morphants (black) and Opa1 morphants (grey) normalized to MMC morphant levels. Significant increases in gene expression pgc1a (a, p = 0.02) and peo1 (b, p = 0.002) were observed in opa1 morphants compared to MMC morphants. Error bars are shown +/- SEM, n = 5. P-values obtained by ANOVA. |
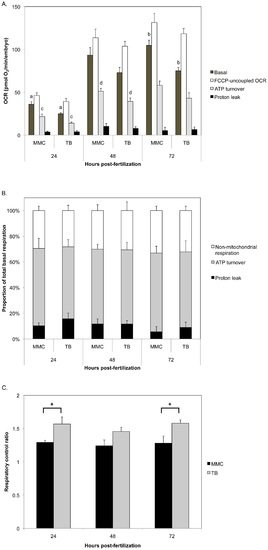
Bioenergetic analysis of Opa1 morphants. Oxygen consumption rates (OCR) were measured in 24, 48, and 72 hpf morphants (mean +/- SEM, n = 5–10). A. Opa1 morphant basal respiration was significantly decreased compared to MMC morphants at 24 and 72 hpf (p = 0.004 (a) and p = 0.0007 (b), respectively). Maximal respiratory capacity and proton leak were not different between groups at any time point. ATP turnover was significantly decreased for Opa1 morphants at 24 and 48 hpf (p = 0.03 (c) and p = 0.04 (d), respectively). B. The proportion of total basal respiration due to non-mitochondrial respiration, ATP turnover and proton leak were similar between Opa1 and MMC morphants. C. Respiratory control ratio was significantly greater for Opa1 morphants than MMC at 24 and 72 hpf (asterisks, p<0.03). P values were determined by Student′s 2-tailed t-test. PHENOTYPE:
|

Phenotypic analysis of SB injected embryos. Embryos and larvae were examined at various time points for phenotype. As with TB-injected embryos, SB-injected embryos develop an area of increased density in the head at 24 hpf (arrow). At 48 hpf, SB-morphant embryos have pooled blood below the heart and hindbrain ventricle enlargement (arrow). By 72 hpf, morphant fish develop enlarged pericardium and have edema around the eyes by 96 hpf. All of these observations are consistent with those observed in TB-injected fish (Fig 2). |

ZFIN is incorporating published figure images and captions as part of an ongoing project. Figures from some publications have not yet been curated, or are not available for display because of copyright restrictions. PHENOTYPE:
|
|
Unillustrated author statements PHENOTYPE:
|