
- Title
-
Pou5f1-dependent EGF expression controls e-cadherin endocytosis, cell adhesion, and zebrafish epiboly movements
- Authors
- Song, S., Eckerle, S., Onichtchouk, D., Marrs, J.A., Nitschke, R., and Driever, W.
- Source
- Full text @ Dev. Cell
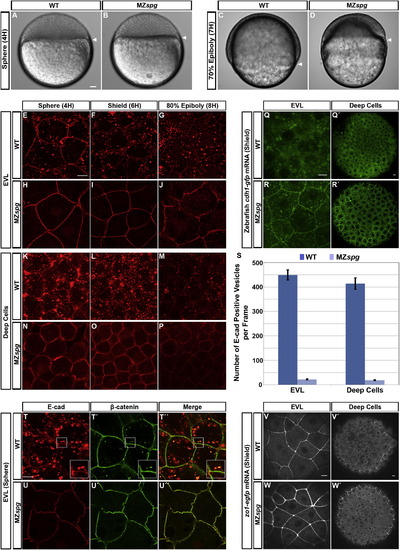
Pou5f1 Controls Subcellular Localization of E-cad(A–D) Live WT and MZspg embryos at sphere and 70% epiboly stages. Arrowheads indicate vegetal front of blastoderm. Lateral views, animal pole to the top. Scale bar, 50 μm.(E–P) Confocal images of anti-E-cad ECD immunofluorescence whole-mount embryos reveal E-cad subcellular localization in WT and MZspg embryos; stages as indicated.(Q–R′) Confocal images of GFP-tagged E-cad expressed from injected mRNA. Live embryos were imaged at shield stage.(S) Quantification of the number of E-cad-positive intracellular vesicles at shield stage (n = 26 embryos each for WT and MZspg. Error bars show SEM; p < 0.001).(T–U3) Coimmunofluorescence of E-cad (red) and β-catenin (green) in WT and MZspg embryos at sphere stage in fixed whole mounts. Insets in (T)–(T′′′) show higher magnification.(V–W′) Confocal images ZO-1-EGFP signal expressed from injected mRNA (shield stage).(E–R′) and (T–W′) Animal views. Scale bars, 10 μm. See also Figure S1 and Movie S1. EXPRESSION / LABELING:
PHENOTYPE:
|
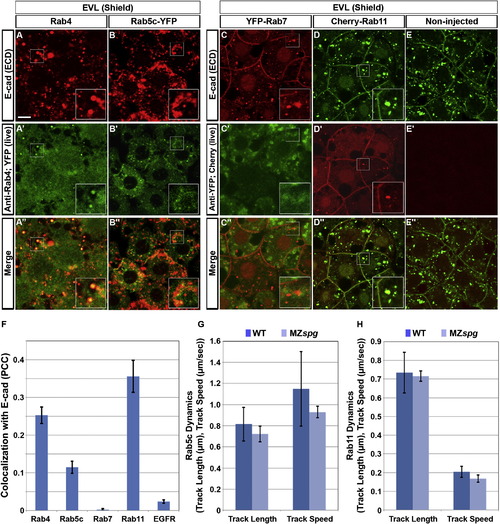
E-cad Colocalizes with Rab4, 5c, and 11, but Not with Rab7-Positive Endosomes(A–E′′) Double immunofluorescence for ECD E-cad (A and C) and Rab4 (A′) or YFP-Rab7 fusion protein (C′), and colocalization of ECD E-cad immunofluorescence (B and D) and Rab5c-YFP or Cherry-Rab11 direct fluorescence (B′ and D′) in EVL cells of shield stage WT embryos. (E–E′′) Noninjected control WT embryos. Insets show higher magnification views of boxed areas. Animal views. Scale bar, 10 μm.(F) Evaluation of colocalization of signals. 25.2% ± 2.1% of Rab4 signal (A′′, n = 12 embryos), 11.4% ± 1.6% of Rab5c signal (B′′, n = 14 embryos), 0.2% ± 0.1% of Rab7 signal (C′′, n = 16 embryos), 35.5% ± 4.2% of Rab11 signal (D′′, n = 9 embryos), or 2.3% ± 0.4% of EGFR signal (see Figure S4, n = 39 embryos) colocalize with E-cad signal. Error bars show SEM. (G and H) Endosomal dynamics. The average track length and mean track speed of Rab5c-YFP (G; n = 14 embryos each in WT and MZspg) and Cherry-Rab11 (H; n = 7 embryos each in WT and MZspg) endosomes in WT and MZspg embryos were measured from time-series recordings (Movie S2). Error bars show SD.See also Figure S2 and Movie S2. EXPRESSION / LABELING:
|
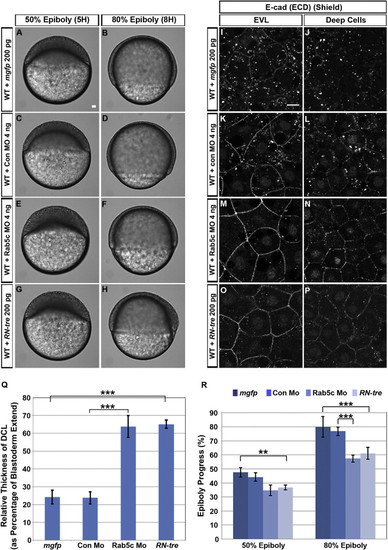
Inhibition of Rab5c Affects Epiboly(A–H) Live WT embryos injected with mRNA encoding membrane-tagged GFP (mGFP) (A and B), control morpholino (con Mo) (C and D), Rab5c MO (E and F), or RN-tre mRNA (G and H) are shown at stages corresponding to WT 50% epiboly and 80% epiboly. Lateral views, animal pole to the top. Scale bar, 50 μm.(I–P) E-cad subcellular localization in mgfp (I and J), control Mo (K and L), Rab5c Mo (M and N), or RN-tre mRNA (O and P) injected WT embryos at shield stage (confocal image of anti-E-cad whole mount immunofluorescence). Animal views. Scale bar, 10 μm.(Q and R) Quantification of (Q) relative DCL thickness at 50% epiboly and (R) epiboly progress at 50% epiboly and 80% epiboly stages (Error bars show SEM; p < 0.01, p < 0.001; n = 12 embryos each).See also Figure S3. EXPRESSION / LABELING:
PHENOTYPE:
|
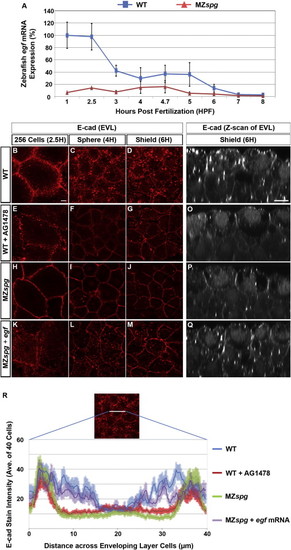
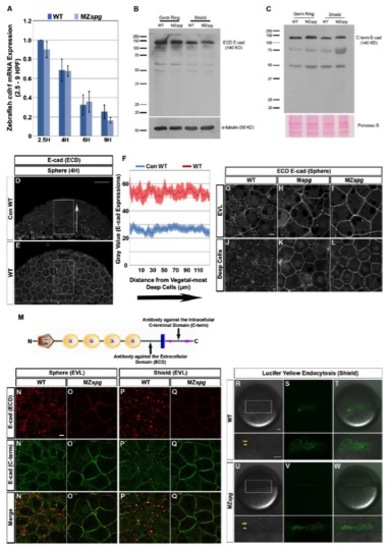
Pou5f1 May Control E-cad Intracellular Localization via Regulation of EGF Expression(A) Time series microarray data of egf mRNA expression in WT and MZspg embryos from four-cell stage to 75% epiboly (1–8 hpf; Onichtchouk et al., 2010). From 1 hpf to MBT, p < 0.01 (n = 3, error bars show SD).(B–Q) E-cad subcellular localization at 256 cells, sphere, and shield stage: (B–M) confocal planes of whole mount anti-E-cad immunofluorescence. Animal views. (N–Q) Confocal z-sections (50 μm) of anti-E-cad ECD immunofluorescence whole mount embryos. Lateral views, animal pole to the top. Scale bars, 10 μm.(R) Quantification of E-cad immunofluorescence signal in a line (highlighted in image) across individual EVL cells. The plot profile represents intensity of E-cad stain in EVL cells of WT, AG1478-treated WT, MZspg, or egf mRNA-injected MZspg embryos (average of 40 cells for each condition). Error bar profiles show SEM. |
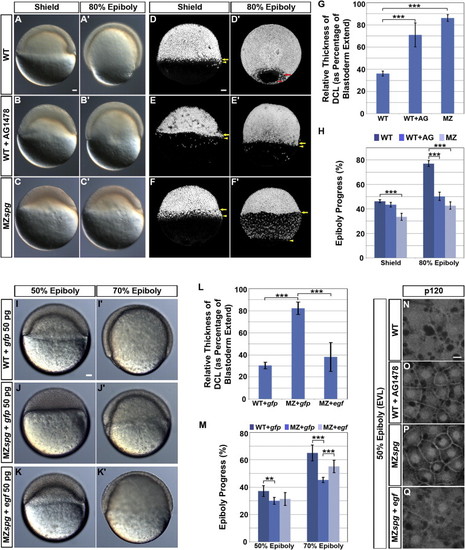
EGF Signaling Controls DCL Thinning and Epiboly Progression (A–F′) Phenotypes of WT, EGFR inhibitor AG1478-treated WT, and MZspg embryos at shield stage and 80% epiboly. (A–C′) Images of live embryos. (D–F′) Confocal z-projection of cell nuclei stained with Sytox green in fixed embryos. Lateral views, animal pole to the top. Scale bars, 50 μm.(G and H) Quantification of relative DCL thickness at shield and epiboly progress at shield and 80% epiboly stages following EGFR inhibition (p < 0.001; n = 12 embryos each; error bars show SEM). (I–K′) Live epiboly phenotypes of control gfp mRNA-injected WT (I and I′), gfp mRNA-injected MZspg (J and J′), and egf mRNA-injected MZspg embryos (K and K′). Lateral views, animal pole to the top. Scale bar, 50 μm. (L and M) Quantification of DCL thickness at 50% epiboly and epiboly progress at 50% epiboly and 70% epiboly stages following egf mRNA injection (error bars show SEM; p < 0.01, p < 0.001; n = 12 embryos each).(N–Q) Confocal images of anti-p120 whole-mount immunofluorescence at 50% epiboly, conditions as indicated. Animal views. Scale bar, 10 μm.See also Figure S4 and Movie S3. EXPRESSION / LABELING:
PHENOTYPE:
|

Pou5f1 and EGF Signaling Control Blastoderm Cell Cohesiveness(A–I) Primary cocultures of dissociated blastoderm cells from embryos labeled by microinjection of Alexa 488-dextran (green) or Rhodamine-dextran (red) at one-cell stage. (A–C) Dissociated cells shown 1 hr after plating, (D–F) after 4 hr incubation, and (G–I) after 8 hr incubation. Scale bar, 50 μm.(J) Percentage of clusters with intermingled cells out of total number of clusters (p < 0.001; WT/WT n = 23, WT/WT+AG1478 n = 36, and WT/MZspg n = 23 focal planes from four experiments).(K) Cell ratios in each cluster after 8 hr incubation (p < 0.001; number of clusters: WT/WT n = 49, WT/WT+AG1478 n = 131, and WT/MZspg n = 50).Error bars show SEM. |

Pou5f1 and EGF Contribute to Control of Blastoderm Cell Migration(A and B) Five minute time series of confocal sections showing deep cell migration in WT (A) and MZspg (B) embryos at 50% epiboly stage. The cell labeled with yellow asterisk slides past neighboring cells, as judged from the position of adherent surfaces (arrowheads). Arrows indicate direction of cell migration. Animal views are shown. Scale bar, 10 μm.(C) Percent change of the adherent surface lengths between 0 and 5 min is significantly higher in WT as compared to MZspg cell clusters (p < 0.001; WT n = 35 focal planes from 12 embryos, MZspg n = 31 focal planes from 11 embryos; error bars show SEM).(D–F′′ ′) Global cell behavior analyzed by 2 hr (sphere to 50% epiboly stage) 3D time-lapse recording of embryos, in which all cell nuclei were labeled by expression of NLS-tomato (confocal stacks 109 μm from the animal pole EVL into the blastoderm). (D–F) Lateral projection views representing a 50 μm sheet transecting the blastoderm perpendicular to the dorsoventral axis were generated and rendered in a 3D image showing the tracks of cell nuclei between 94 and 115 min of the recording. The marked area is shown enlarged at right for time windows as indicated. The plotted lines show tracks of nuclei over 21 min. WT (D) and AG1478-treated WT (E) have longer tracks than MZspg (F). Lateral views, animal pole to the top. Scale bar, 50 μm (D–F).(G–I) Quantification of the average track length, effective net displacement length, and track speed mean are shown (p < 0.01; p < 0.001; n = 6 embryos each; error bars show SEM).(J) A model for the regulatory cascade by which Pou5f1 controls cell behavior during epiboly.See also Figure S5 and Movie S4. |
E-cad Expression and YSL Endocytic Band Phenotypes in Pou5f1-deficient Embryos |

E-cad Immunoreactive Endosomes Colocalize with Rab5c, and 11, but not with Rab7 (Related to Figure 2) |
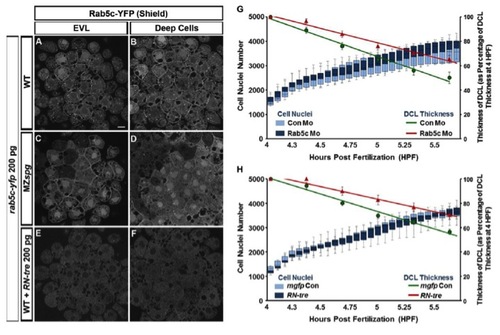
Comparison of Plasma Membrane Distribution of Rab5c-YFP and Number of Cell Nuclei during Early Epiboly |
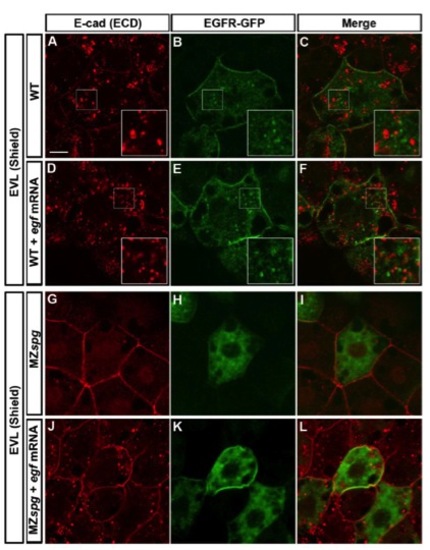
Comparison of EGF-mediated Vesicular Trafficking of E-cad and EGFR-GFP |
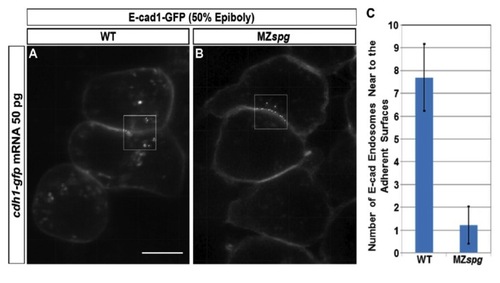
Number of E-cad Endosomes Adjacent to Adherent Surfaces is smaller in MZspg Blastoderm Cells than WT |
Reprinted from Developmental Cell, 24(5), Song, S., Eckerle, S., Onichtchouk, D., Marrs, J.A., Nitschke, R., and Driever, W., Pou5f1-dependent EGF expression controls e-cadherin endocytosis, cell adhesion, and zebrafish epiboly movements, 486-501, Copyright (2013) with permission from Elsevier. Full text @ Dev. Cell