
- Title
-
Lethal giant larvae 2 regulates development of the ciliated organ Kupffer's vesicle
- Authors
- Tay, H.G., Schulze, S.K., Compagnon, J., Foley, F.C., Heisenberg, C.P., Yost, H.J., Abdelilah-Seyfried, S., and Amack, J.D.
- Source
- Full text @ Development
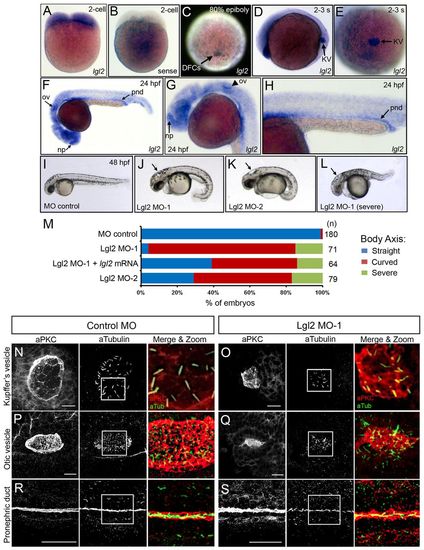
Lgl2 controls development of ciliated organs. (A-H) Whole-mount RNA in situ hybridizations. At the 2-cell stage, antisense lgl2 probes show that lgl2 mRNA is maternally supplied (A). Control lgl2 sense probes showed little background staining (B). lgl2 expression localized in the enveloping layer and dorsal forerunner cells (DFCs) at the 80% epiboly stage (C) and was prominently expressed in Kupffer’s vesicle (KV) at the 2-3 somite(s) stages (D,E). At 24 hpf, lgl2 is highly expressed in the ciliated nasal placodes (np), otic vesicles (ov) and pronephric ducts (pnd) (arrows in F). G and H show higher magnification images of lgl2 expression in the nasal placode and otic vesicle (G) and pronephric duct (H). (I-L) Embryo morphology at 2 dpf. Control embryos (I) had a straight body, whereas Lgl2 MO-1 (J) and Lgl2 MO-2 (K) embryos often showed a curved body. Lgl2 MO embryos also developed hydrocephalus (arrows in J-L) and in some cases had additional severe axial defects (L). (M) Percentage of embryos with body axis defects. n, number of embryos analyzed. (N-S) Fluorescence immunostaining using aPKC antibodies (red) to mark apical membranes of epithelial cells and acetylated tubulin antibodies (green) to label cilia revealed defects in the development of ciliated epithelia in KV (N,O), otic vesicles (P,Q) and pronephric ducts (R,S) in Lgl2 MO embryos (O,Q,S) relative to controls (N,P,R). White boxes indicate areas enlarged in ‘Merge & Zoom’ panels. Scale bars: 20 μm. EXPRESSION / LABELING:
PHENOTYPE:
|

Lgl2 depletion disrupts KV lumen and cilia formation. (A,B) Ciliated KV cells were labeled by acetylated tubulin immunostaining (red) and GFP expression (green) in Tg(sox17:GFP) embryos injected with control (A) or Lgl2 (B) MO. Scale bars: 20 μm. (C-E) KV cilia number (C), KV cilia length (D) and KV lumen size (E) were significantly reduced in Lgl2 MO embryos compared with MO control and uninjected controls. lgl2 mRNA partially rescued each of these defects. (F) The number of KV cells was similar among control and Lgl2 MO embryos in Tg(dusp6:memGFP) and Tg(sox17:GFP) transgenic lines. Error bars indicate s.d. n, number of embryos analyzed. *P<0.05. EXPRESSION / LABELING:
PHENOTYPE:
|

Lgl2 is required for normal left-right asymmetry. (A) Asymmetric heart looping at 2 dpf visualized in Tg(cmlc2:GFP) transgenic embryos that express GFP in the heart. In control embryos, the heart (black arrow) looped to the right, whereas Lgl2 MO knockdown often resulted in reversed or no heart looping (red arrows). (B) Percentage of embryos with heart-looping defects. Injecting a lower dose of Lgl2 MO-1 revealed that looping defects are dose dependent, and co-injecting lgl2 mRNA partially rescued Lgl2 MO-1 and Lgl2 MO-2 heart defects. Injecting lgl2 mRNA alone also disrupted heart looping. (C) RNA in situ hybridization analysis of spaw expression, which was detected in left lateral plate mesoderm (LPM) (arrowhead) and bilaterally in the tail (arrows) at 14 hpf in controls. Lgl2 MO embryos showed disrupted LPM spaw expression, including right-sided, bilateral and absent expression (red arrowheads). (D) Analysis of LPM spaw expression in control and Lgl2 MO embryos. n, number of embryos analyzed. L, left; R, right. EXPRESSION / LABELING:
PHENOTYPE:
|

Lgl2 localizes to basolateral membranes in KV cells and E-cadherin is disrupted in Lgl2 knockdown embryos. (A) Fluorescence immunostaining using Lgl2 antibodies showed Lgl2 localized at basolateral membranes of KV cells and was excluded from the apical domain enriched with phalloidin staining of filamentous actin (F-Actin). (B) Lgl2:EYFP fusion protein also localized at basolateral membranes of KV cells and near E-cadherin staining. (C,D) In MO control Tg(dusp6:memGFP) embryos, E-cadherin localized at lateral membranes (C), whereas Lgl2 MO knockdown reduced membrane accumulation of E-cadherin (D). Boxes indicate enlarged regions shown in the individual channels. Arrows point out representative lateral membranes. Scale bars: 20 μm. EXPRESSION / LABELING:
PHENOTYPE:
|
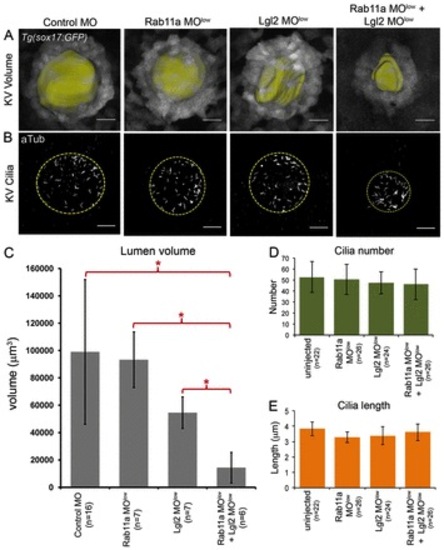
Genetic interaction between Lgl2 and Rab11a regulates KV lumen formation uncoupled from ciliogenesis. (A,B) Images of GFP-labeled KV cells were used to determine KV lumen volumes (pseudocolored yellow) in live Tg(sox17:GFP) embryos (A) and acetylated tubulin antibodies were used to stain KV cilia (B) in MO control embryos and embryos injected with sub-optimal Rab11a MOlow, Lgl2 MOlow or co-injected with Rab11a MOlow + Lgl2 MOlow. The dashed circle outlines the approximate boundary of KV lumen. Scale bars: 20 μm. (C) Average volume of KV lumen at the 8-somite stage. (D,E) Analysis of KV cilia number (D) and length (E) showed that KV cilia were not significantly affected in Rab11a MOlow + Lgl2 MOlow embryos. Error bars indicate s.d. n, number of embryos analyzed. *P<0.05. EXPRESSION / LABELING:
PHENOTYPE:
|
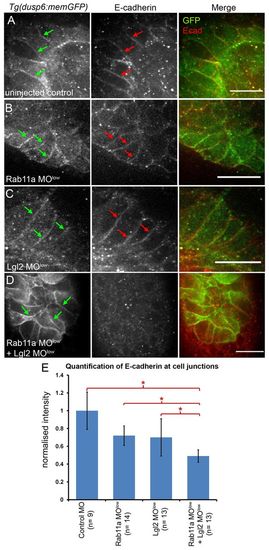
Lgl2 and Rab11a control E-cadherin accumulation at KV cell junctions. (A-D) Optical sections showing E-cadherin immunostaining in KV cells of Tg(dusp6:memGFP) embryos. GFP (green arrows) and E-cadherin (red arrows) accumulate at lateral membranes in control (A), Rab11a MOlow (B) and Lgl2 MOlow (C) embryos. E-cadherin membrane staining was reduced in Rab11a MOlow + Lgl2 MOlow embryos (D). Scale bars: 20 μm. (E) Quantification of E-cadherin staining along lateral KV membranes. Average fluorescence intensities from multiple experiments were normalized to controls. Error bars indicate s.d. n, number of embryos analyzed. *P<0.05. EXPRESSION / LABELING:
PHENOTYPE:
|

Depletion of Lgl2 reduced KV lumen volume, but did not alter localization of apical epithelial markers. (A) Analysis of KV lumen volume at the 8-somite stage in live Tg(dusp6:memGFP) embryos. Error bars represent s.d. n, number of embryos analyzed. *P<0.05. (B,C) Fluorescence staining of apical markers in Tg(dusp6:memGFP) embryos injected with control MO or Lgl2 MO. ZO-1 (B) and F-Actin (C) were localized at apical membranes lining the KV lumen in both control and Lgl2-depleted embryos. Scale bars: 20 μm. |
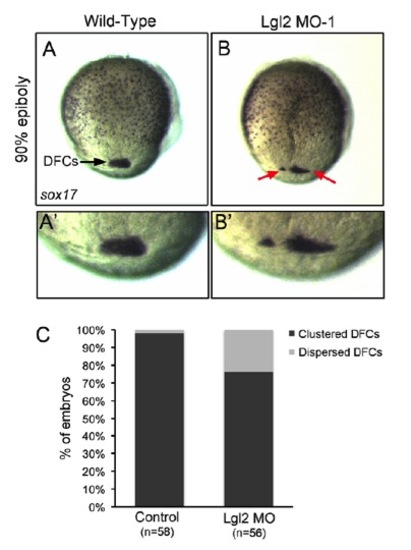
DFC clustering was disrupted in a subset of Lgl2 knockdown embryos. (A-B′) RNA in situ hybridization of sox17 expression was used to analyze DFCs (arrows) at the 90% epiboly stage. A′ and B′ are magnified views of DFCs in A and B, respectively. (C) DFCs were tightly clustered in most control embryos (A,A′C), whereas DFCs were dispersed in 23% of Lgl2 MO embryos (B,B′,C). n, number of embryos analyzed. |

The embryonic midline is intact in Lgl2-depleted embryos. (A) Lateral views of live Tg(shh:GFP) embryos that express GFP in the notochord. The notochord was intact and appeared similar in control MO and Lgl2 MO embryos at the 18-somite stage. (B) Posterior views of double RNA in situ hybridization staining of sonic hedgehog (shha; red) and lefty1 (lft1; purple) at the 8-somite stage when lft1 expression is initiated in the posterior notochord. Strong lft1 expression in the notochord, which provides a molecular barrier between left (L) and right (R), was observed in most control MO (83%, n=72) and Lgl2 MO (84%, n=56) embryos, indicating lft1 activation is not delayed in Lgl2 MO embryos. |

Lgl2 antibody staining is reduced in Lgl2 MO embryos. (A,B) Maximum projections of Lgl2 and acetylated tubulin immunostaining in the KV region show that the membrane-localized Lgl2 staining observed in the uninjected embryos (A) is reduced in Lgl2 MO embryos (B). |
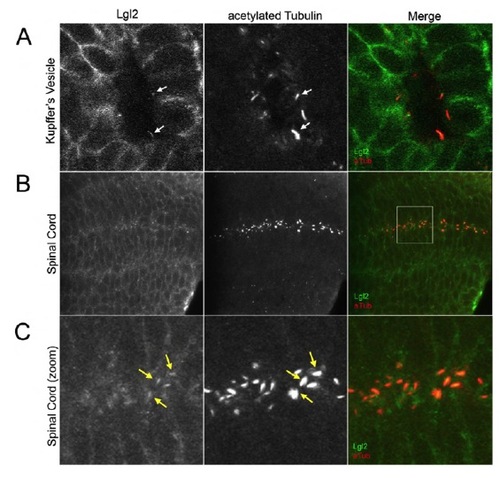
Lgl2 localizes to cell membranes and some motile cilia in KV and the spinal cord. (A-C) Whole embryo fluorescence immunostaining using Lgl2 antibodies and acetylated tubulin antibodies indicates that Lgl2 localizes to cell membranes and colocalizes with acetylated tubulin in in some KV cilia (arrows in A) and cilia in the spinal cord (arrows in B,C) in wild-type embryos. The box in B identifies the region enlarged in C. |

Rab11a MO knockdown disrupted KV development and left-right asymmetry. (A,B) KV cilia immunostained with acetylated tubulin antibodies showing a reduced KV size concomitant with a slight reduction in cilia number and length in embryos injected with an optimal dose of Rab11a MO (B) relative to MO control (A). The dashed circle outlines the approximate boundary of KV lumen. Scale bars: 20 μm. (C) Approximately 43% of the Rab11a MO embryos contained a reduced KV compared with MO control embryos. (D) Quantification of KV lumen area. (E,F) KV cilia number (E) and length (F) were significantly reduced in Rab11a MO embryos relative to controls. Error bars represent s.d. n, number of embryos analyzed. *P<0.05. (G) Consistent with KV defects, embryos injected with an optimal dose of Rab11a MO showed defects in heart left-right asymmetry. These defects were partially rescued by co-injecting rab11a mRNA. n, number of embryos analyzed. |