
- Title
-
Novel oxytocin gene expression in the hindbrain is induced by alcohol exposure: transgenic zebrafish enable visualization of sensitive neurons
- Authors
- Coffey, C.M., Solleveld, P.A., Fang, J., Roberts, A.K., Hong, S.K., Dawid, I.B., Laverriere, C.E., and Glasgow, E.
- Source
- Full text @ PLoS One

Ethanol exposure reduces the number of gsc:GFP expressing neurons. A, the duration and embryonic stage of 2% ethanol treatments in Tg(gsc:GFP) embryos are illustrated with solid bars. Colors indicate the treatment had no effect (green), slightly reduced (yellow), or reduced (red) GFP expression. Inset, the average numbers of GFP positive cells in the preoptic area (POA) of 72 hpf embryos treated with 2% ethanol for 24 hrs at 24 hpf (n = 12) and vehicle control (n = 10). Ethanol treatment resulted in a highly significant reduction of GFP-expressing cells in the POA, ***p<0.001. Error bars represent SEM. B, C, ventral views of Tg(gsc:GFP) embryos at 48 hpf. B, is the control. C, treated with 2% ethanol for 18 hrs at 24 hpf. GFP expression in the neuroendocrine preoptic area (arrowheads) was dramatically reduced in the embryos exposed to ethanol. The embryo and eyes (e) are outlined (dashed white line). |

Different groups of neurons are sensitive to ethanol exposure at specific developmental stages. A, the duration and embryonic stage of 2% ethanol treatments illustrated with colored bars for Tg(isl1:GFP) embryos, as described in Fig. 1. BE, dorsal views of Tg(isl:GFP) larva at 7 dpf. B, is the control. GFP expression was evident in the forebrain nuclei (F1 and F2 arrows), the mesencephalic cluster (arrowhead) and cranial motor nuclei III, IV, V, VII, and X (labeled). C, GFP expression in the forebrain and mesencephalic cluster was absent, and GFP expression in cranial motor nuclei III and IV was reduced (labeled) after 2% ethanol treatment for 24 hrs at the 70% epiboly stage. D, E, GFP expression was largely normal after treatment with 2% ethanol for 24 hrs at 24 hpf (D) and for 24 hrs at 48 hpf (E). Eyes (e), otic capsule (oc), olfactory epithelium (oe). F, the average numbers of GFP-positive cells in individual brain nuclei of control (n = 10) and ethanol-treated (n = 10) embryos. A highly significant reduction in GFP-expressing cells in the two forebrain nuclei, F1 (p = 0.001) and F2 (p<0.001), and cranial motor nucleus III (p<0.05) was observed. In contrast, a slight reduction in GFP cells in motor nuclei IV, V and VII was not significant. Error bars represent SEM. ***p<0.001, **p<0.01, *p<0.05. EXPRESSION / LABELING:
|
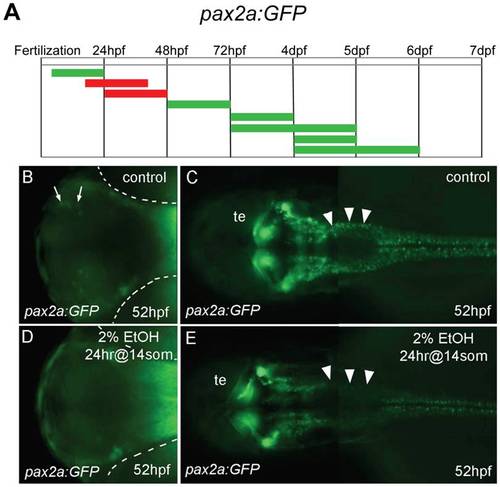
Forebrain and hindbrain pax2a:GFP positive cells are sensitive to ethanol exposure. A, the duration and embryonic stage of 2% ethanol treatments illustrated with colored bars for Tg(pax2a:GFP) embryos, as described in Fig. 1. B-E, ventral views (B, D) and dorsal views (C, E) of Tg(pax2a:GFP) embryos at 52 hpf. B, C, are controls. D, E, were treated with 2% ethanol for 24 hrs at the 14 somite stage. B, D, a small, distinct group of neurons in the forebrain (arrows in B) were missing after ethanol exposure (D). The location of the eyes is outlined (dashed white lines). C, E, neurons around the midbrain-hindbrain region were mostly unaffected, hindbrain neurons were drastically reduced (arrowheads), and spinal cord neurons appeared slightly reduced. Tectum (te). EXPRESSION / LABELING:
|
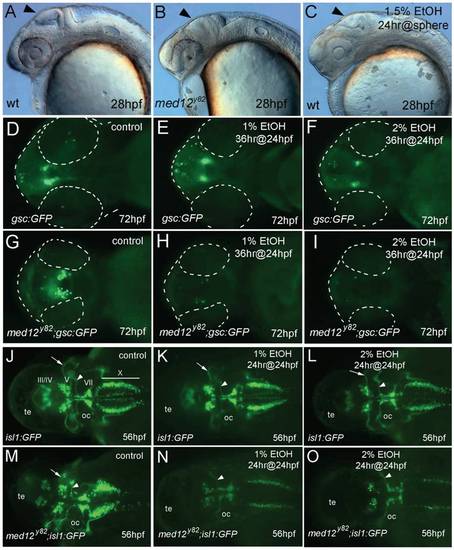
Neurons are sensitized to ethanol in med12 mutant embryos. AC, 28 hpf embryos. A, wild-type (wt), B, med12y82 mutant, and C, wt embryo treated at sphere stage with 1.5% ethanol for 24 hrs. Note the similarly retarded brain development in the med12y82 and ethanol treated embryos (arrows). DI, ventral views at 72 hpf of Tg(gsc:GFP) embryos (D, E, F) and med12y82; Tg(gsc:GFP) embryos (G, H, I). D, G, control embryos. E, H, treated with 1% ethanol for 36 hrs at 24 hpf. F, I, treated with 2% ethanol for 36 hrs at 24 hpf. Embryos and eyes are outlined (dashed white lines). J-O, Tg(isl1:GFP) embryos (J, K, L) and med12y82; Tg(isl1:GFP) embryos (M, N, O) at 56 hpf, dorsal views. J, M, control embryos. K, N, treated with 1% ethanol for 24 hrs at 24 hpf. L, O, treated with 2% ethanol for 24 hrs at 24 hpf. GFP-expressing cranial motor neurons (labeled) diminished in med12y82; Tg(isl1:GFP) embryos, especially in nuclei III and IV. A reduction of nucleus V neurons in med12y82; Tg(gsc:GFP) embryos treated with ethanol is illustrated by the elimination of the prominent nV axons (arrows). In contrast, the prominent nVII axons remained intact (arrowheads). Otic capsule (oc), tectum (te). EXPRESSION / LABELING:
PHENOTYPE:
|

Ethanol exposure causes similar levels of neuronal cell death in wild-type and med12 mutant embryos. A-D, acridine orange stained embryos at 48 hpf, ventral views. A, untreated wild-type (wt) embryo. B, wt embryo treated with 2% ethanol for 18 hrs at 24 hpf. C, untreated med12y82 embryo. Med12y82 and wt embryos showed similar low levels of apoptosis. D, med12y82 embryo treated with 2% ethanol for 18 hrs at 24 hpf. Med12y82 and wt embryos treated with 2% ethanol showed similar increases in acridine orange staining. E, the average numbers of apoptotic cells in the brains of med12y82 and control embryos treated with ethanol as in panels AD. There were significantly more apoptotic cells in the brains of med12y82 embryos compared to wild-type embryos (p<0.05), however, following EtOH exposure, the numbers of apoptotic cells in the brains of both med12y82 and wild-type embryos greatly increased. The number of apoptotic cells in the brains of med12 mutant embryos increased 2.8-fold compared to their untreated med12 mutant siblings (p = 0.073), while apoptotic cells increased over 5-fold in ethanol-treated wild-type embryos compared to their untreated siblings (p<0.005). Error bars represent SEM. **p<0.01, *p<0.05. PHENOTYPE:
|

Expression of GFP in Tg(oxtl:GFP) embryos corresponds exactly with the expression of endogenous oxtl mRNA. A,B, ventral view of 48 hpf embryos. A, whole-mount in situ hybridization for oxtl mRNA in a 48 hpf embryo. B, GFP expression visualized with epi-fluorescence in a 48 hpf Tg(oxtl:GFP) embryo. Epi-fluorescent and differential interference contrast (DIC) images are overlaid. The oxtl expressing cells are indicated with arrowheads. EXPRESSION / LABELING:
|
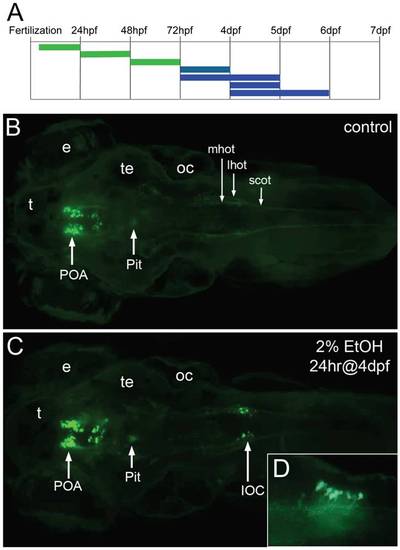
Expression of the oxtl:GFP transgene is induced in the hindbrain by exposure to ethanol. A, the duration and embryonic stage of 2% ethanol treatments are illustrated with solid bars. Oxtl:GFP expression in the neuroendocrine preoptic area was unaffected with all treatments (green), while oxtl:GFP was induced in the hindbrain by later treatments (blue). B, C, Tg(oxtl:GFP) larva shown at 6 dpf, dorsal views. B, control embryo, C, treated with 2% ethanol for 24 hrs at 4 dpf. A small group of large GFP-expressing neurons appears in the hindbrain of the ethanol-treated larva. We call these ethanol-induced GFP-expressing neurons, induced oxytocin cells (IOC). D, inset, a higher magnification view of the IOCs shows processes that appear to enter the hindbrain oxytocinergic tracks, lateral view. Eyes (e), lateral hindbrain oxytocinergic tract (lhot), medial hindbrain oxytocinergic tract (mhot), otic capsule (oc), pituitary (Pit), preoptic area (POA), spinal cord oxytocinergic tract (scot), tectum (te), telencephalon (t). EXPRESSION / LABELING:
|
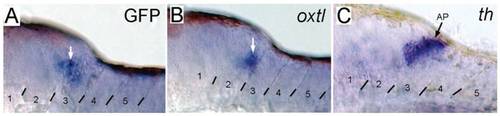
Expression of oxtl mRNA is induced in the hindbrain by exposure to ethanol. Whole mount in situ hybridization was used to detect: A, GFP; B, oxtl; and C, tyrosine hydroxylase (th) mRNAs in Tg(oxtl:GFP) larva treated with ethanol for 24 hrs at 4 dpf, and then fixed at 6 dpf. th labels dopaminergic and noradrenergic neurons located in the area postrema. Examples of positive staining are indicated by arrows. EXPRESSION / LABELING:
|
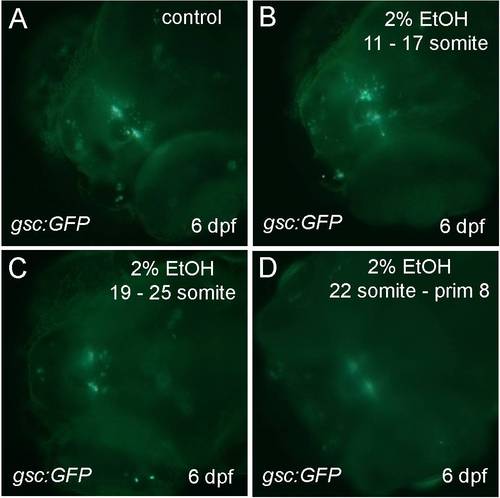
Ethanol exposure during the predicted time period of initial differentiation of gsc-expressing cells had no effect on gsc:GFP expression. A–D, Tg(gsc:GFP) larval at 6 dpf, dorsal views. A, is control. B, treated with 2% ethanol from 11 to 17 somites stage. C, treated with 2% ethanol from 19 to 25 somites stage. D, treated with 2% ethanol from 22 somites to prim8 stage. |

Ethanol exposure later than 48 hpf had no effect on gsc:GFP expression. A-F, Tg(gsc:GFP) larval at 7 dpf, dorsal views. A, is control. B, treated with 2% ethanol for 24 hrs at 70% epiboly. C, treated with 2% ethanol for 24 hrs at 24 hpf. D, treated with 2% ethanol for 24 hrs at 2 dpf. E, treated with 2% ethanol for 24 hrs at 3 dpf. F, treated with 2% ethanol for 24 hrs at 4 dpf. |

Ethanol exposure had no apparent overall effect on post-mitotic neurons visualized by elavl3:GFP expression. A-C, Tg(elavl3:GFP) larva at 5 dpf, DIC and fluorescent composite photomicrographs, dorsal views. A, is control. B, treated with 1% ethanol for 13 hrs at 35 hpf. C, treated with 2% ethanol for 13 hrs at 35 hpf. |

Ethanol exposure had no apparent overall effect on post-mitotic neurons visualized by elavl3:GFP expression. A-C, Tg(elavl3:GFP) larva at 5 dpf, DIC and fluorescent composite photomicrographs, dorsal views. A, is control. B, treated with 1% ethanol for 13 hrs at 35 hpf. C, treated with 2% ethanol for 13 hrs at 35 hpf. |

Ethanol exposure had no effect on the overall numbers of post-mitotic neurons in wild-type Tg(elavl3:GFP) embryos, while med12y82 mutant embryos had fewer post-mitotic neurons that became further reduced after ethanol exposure. A-F, lateral view of 36 hpf embryos. A-C, wild-type Tg(elavl3:GFP) embryos. D-F, med12y82;Tg(elavl3:GFP) embryos. A, D, controls. B, E, treated with 1% ethanol from dome stage to 24 hpf. C, F, treated with 2% ethanol for 24 hrs at 3 dpf. G, quantitation of GFP expression by real-time quantitative RT-PCR. GFP expression was normalized to β-actin as an internal control. Relative quantity was compared to control wild-type Tg(elavl3:GFP) embryos (HuC). The relative quantity of GFP in control wild-type Tg(elavl3:GFP) embryos was set to one, which is zero on the log scale. The relative expression of GFP trends higher in med12y82 mutant (kto) embryos and in ethanol-treated embryos as shown by the red bars. Although the overall amount of GFP expression in med12y82 mutant and ethanol-treated embryos appears to be somewhat reduced in panels A-F, when normalized to β-actin GFP expression is essentially equal or even increased relative to control wild-type embryos. This suggests that neither ethanol exposure nor med12 mutation results in a relative reduction in post-mitotic neurons. Error bars represent 95% confidence levels. |
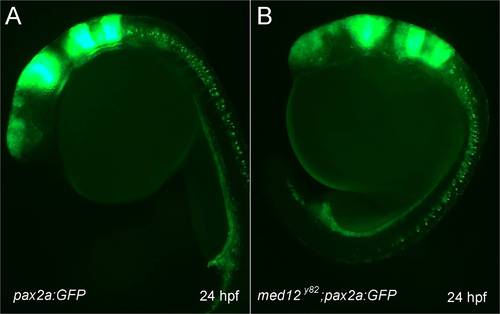
Early pax2a:GFP expression was similar in wild-type and med12y82 embryos. A, B, lateral view of 24 hpf embryos. A, wild-type Tg(pax2a:GFP) embryo. B, med12y82;Tg(pax2a:GFP) embryo. |
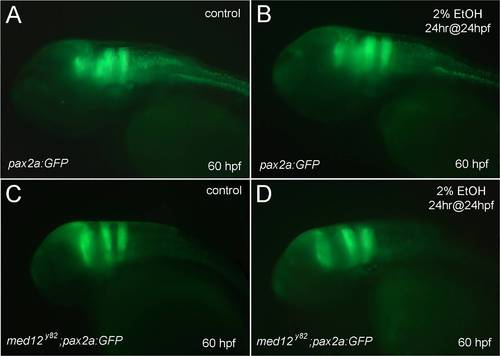
Pax2a:GFP expression was reduced in the hindbrain following ethanol exposure in wild-type, and is severely depleted in med12y82 embryos. A-D, lateral views of 60 hpf embryos. A, B, wild-type Tg(pax2a:GFP) embryos. C, D, med12y82;Tg(pax2a:GFP) embryos. A, C, controls. B, D, treated with 2% ethanol for 24 hrs at 24 hpf. |