
- Title
-
S1pr2/Gα13 signaling controls myocardial migration by regulating endoderm convergence
- Authors
- Ye, D., and Lin, F.
- Source
- Full text @ Development
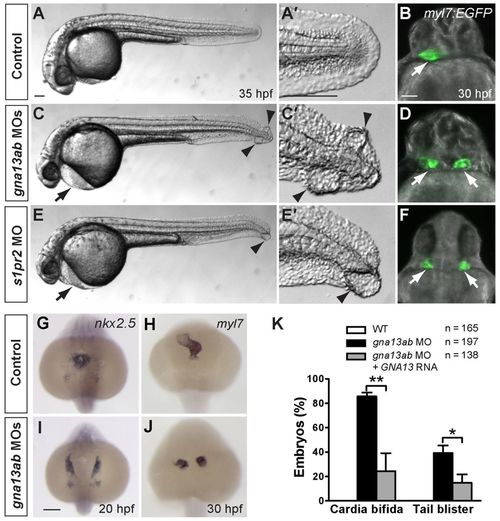
Gα13 signaling is required for myocardial migration. (A-F) Comparison of control embryos (A,B), embryos injected with MOs against both gna13a and gna13b (C,D, gna13ab MOs), and embryos injected with a MO against s1pr2/mil (E,F) at 35 hpf. (A,C,E) Lateral bright-field images of embryos. Anterior is towards the left; arrows indicate pericardial edema; arrowheads indicate tail blisters. (A′,C′,E′) High-magnification images of the tail region of each embryo. (B,D,F) Overlay of epifluorescence and bright-field images of Tg(myl7:EGFP) embryos at 30 hpf. Ventral view; white arrows indicate hearts. (G-J) Expression of nkx2.5 and myl7, as detected by whole-mount in situ hybridization, in control and gnb13ab MO-injected embryos. Dorsoanterior view with anterior upwards. (K) Frequencies of cardia bifida and tail blistering in 35 hpf embryos injected with gna13ab MOs, alone or together with an RNA encoding the human Gα13 (GNA13). *P<0.05; **P<0.01. Data are mean±s.e.m. Scale bars: 100 μm. EXPRESSION / LABELING:
PHENOTYPE:
|

Gα13 acts downstream of S1pr2 to regulate myocardial migration. (A-D) myl7 expression detected by in situ hybridization in the indicated embryos at 30 hpf. Dorsoanterior view with anterior upwards. (E) Frequencies of cardia bifida and tail blistering in 35 hpf embryos injected with the s1pr2 MO, alone or together with the gna13a RNA. *P<0.05. Data are mean±s.e.m. Scale bar: 100 μm. |

Gα13 and RhoGEF act downstream of S1pr2. (A-F) Disruption of either Gα13 or RhoGEF suppresses the gastrulation defects resulting from overexpression of S1pr2. (A-C) ntl expression detected by in situ hybridization in control embryos and in embryos injected with s1pr2 RNA, alone or together with gna13ab MOs, at 8 hpf. Dorsal view, with vegetal pole (VP, blue line) towards the bottom; black arrows indicate positions of the deep-cell margin (dcm); double-headed blue arrows indicate distance from the dcm to VP; red lines indicate axial mesoderm. (D,E) Bright-field images of 35 hpf embryos injected with the s1pr2 RNA, alone or together with the Arhgef11RGS RNA. Lateral view; red asterisk indicates cyclopia; arrow indicates pericardial edema; arrowheads indicate tail blisters. (F) Frequencies of embryos exhibiting gastrulation defects. **P<0.01 versus s1pr2 RNA-injected embryos. Data are mean±s.e.m. (G-I) Interference with RhoGEF function disrupts myocardial migration. Embryo injected with the Arhgef11RGS RNA at 35 hpf. (G) Lateral bright-field image showing pericardial edema (arrow) and tail blisters (arrowheads). The inset shows a high-magnification image of the tail region in the boxed area. (H) Overlay of epifluorescence and bright-field images, showing the locations of EGFP-expressing cardiomyocytes (arrows) in Tg(myl7:EGFP) embryos. Ventral view. (I) myl7 expression, as detected by in situ hybridization in control embryos and in embryos injected with s1pr2 RNA, alone or together with gna13ab MOs, at 8 hpf. Dorsoanterior view. Scale bars: 100 μm. EXPRESSION / LABELING:
|
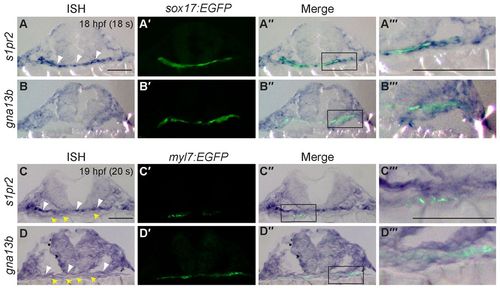
s1pr2 and gna13 are expressed in the endoderm and cardiomyocytes during segmentation. (A-D′) Transverse sections of Tg(sox17:EGFP) (A,B) and Tg(myl7:EGFP) (C,D) embryos at 18- and 20-somite stages. Shown are s1pr2 (A-A′′′,C-C′′′) and gna13a (B-B′′′,D-D′′′) transcript, as detected by in situ hybridization (A-D), and EGFP expression in endodermal cells (A′,B′) and cardiomyocytes (C′,D′) as detected by immunofluorescence staining (anti-GFP antibody). (A′′-D′′) Merged images of A-D and A′-D′. (A′′′-D′′′) High-magnification images of the boxed regions in A′′-D′′. Yellow arrows, endoderm; white arrowheads, cardiomyocytes. Scale bars: 100 μm. EXPRESSION / LABELING:
|

S1pr2/Gα13 signaling is required for convergent movement of the anterior endoderm during segmentation. (A-I) Epifluorescence images of the anterior endoderm in Tg(sox17:EGFP) control, milm93 mutant or gnb13ab MOs-injected embryos raised at 25°C at the indicated stages. Yellow lines (equivalent length among embryos at the same stage) indicate the width of the anterior endodermal sheet; red asterisks indicate endodermal holes. (J) Quantification of endoderm width in each group. *P<0.05, **P<0.01 versus control. Data are mean±s.e.m. (K) The cell-transplantation procedure. Sox32-overexpressing and rhodamine-dextran labeled wild-type or s1pr2 morphant donor cells were transplanted into Tg(sox17:EGFP) host embryos. (L-O) Still images from time-lapse movies, showing the anterior endoderm in wild-type Tg(sox17:EGFP) hosts transplanted with rhodamine-labeled donor cells (L,M are wild type; N,O are s1pr2 morphant) at 3 and 10 somites. Green and red lines indicate the width of the host and donor endodermal sheets, respectively. (P) Convergence velocity of the wild-type and s1pr2 morphant endoderm populations. **P<0.001; #P=0.96 versus the control. Data are mean±s.e.m. Scale bars: 100 μm. EXPRESSION / LABELING:
PHENOTYPE:
|
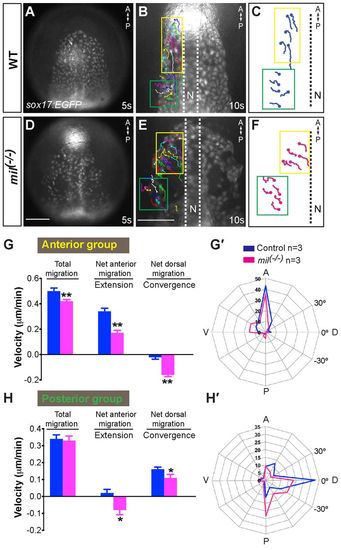
S1pr2 is required for efficient convergence and extension movements of the anterior endoderm. Epifluorescence time-lapse experiments performed on Tg(sox17:EGFP) control (A-C) and mil mutant (E,F) embryos from the 5- to 10-somite stages (supplementary material Movies 3, 4). (A,D) Still images at the 5-somite stage. (B,E) Still image at the 10-somite stage, with the migration tracks of endodermal cells from the 5- to 10-somite stage superimposed. (C,F) Representative tracks delineate routes of the two populations of anterior endodermal cells (yellow is the anterior group, cells migrate anteriorly; green is the posterior group, cells migrate dorsally). (G,H) Total, net anterior (extension) and net dorsal (convergence) migration velocity of the anterior- and posterior-group endodermal cells in wild-type and mil mutant embryos. Data are mean±s.e.m. (G′,H′) Direction of cell migration throughout the time-lapse period (5-minute intervals), shown as the percentage of cells in 30° sectors. *P<0.05 versus control; **P<0.01. Scale bar: 100 μm. EXPRESSION / LABELING:
PHENOTYPE:
|

Disrupting the S1pr2/Gα13/RhoGEF signaling pathway causes defects in endoderm morphogenesis, as well as in myocardial migration. (A-F) Epifluorescence images of the anterior regions of the endoderm in 26 hpf, double-transgenic Tg(sox17:EGFP)/(myl7:EGFP) embryos. (A) Control uninjected siblings. (B-F) Embryos injected with: the gnb13ab MOs alone (B); the gnb13ab MOs plus the GNA13 RNA (C); the GNA13 RNA alone (D); the s1pr2 MO (E); and the Arhgef11RGS RNA (F). Dorsoanterior views with anterior upwards; yellow dots indicate cardiomyocytes; yellow lines (same length) indicate the width of the anterior endodermal sheet; blue asterisks indicate endodermal holes. (G) A proposed model for how S1pr2 regulates myocardial migration (see text for details). (H) Frequencies of incidences of endodermal holes and cardia bifida in 26 hpf embryos injected with the indicated MOs and RNAs. (I) Endodermal width and the distance between two populations of cardiomyocytes in 26 hpf embryos (obtained from the same pair of fish) injected with the indicated MOs and RNAs. *P< 0.01 versus control; **P<0.01 versus gna13ab MOs; #P>0.05 versus control. Data are mean±s.e.m. Scale bar: 100 μm. |
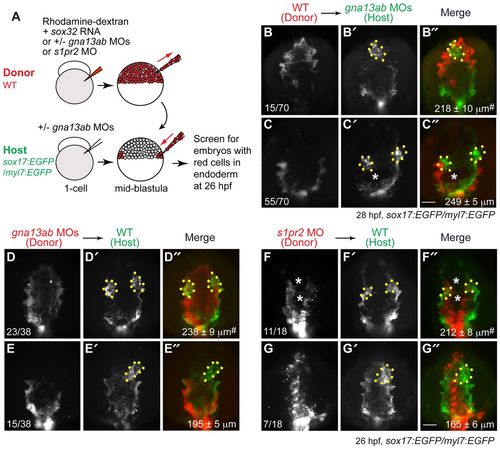
S1pr2/Gα13 signaling functions autonomously within the endoderm to regulate myocardial migration. (A) The cell transplantation procedures. Sox32-overexpressing and rhodamine-dextran labeled wild-type or gna13ab or s1pr2 morphant donor cells were transplanted into Tg(sox17:EGFP)/(myl7:EGFP) host embryos. In the case of hosts to be injected with wild-type donor cells, the embryos were injected with gna13ab MOs. (B-G′′) Epifluorescence images of the anterior region of Tg(sox17:EGFP)/(myl7:EGFP) hosts at 26-28 hpf, showing the morphology of the anterior endoderm and cardiomyocytes. (B-C′′) Wild-type donor cells were transplanted into gna13ab morphant hosts. (D-E′′) gna13ab morphant donor cells were transplanted into wild-type hosts. (F-G′′) s1pr2 morphant donor cells were transplanted into wild-type hosts. (B-G) Rhodamine-dextran labeling donor cells. (B′-G′) GFP-expressing anterior endoderm and cardiomyocytes. (B′′-G′′) Merged images of B′-G′ and B-G. Dorsoanterior view with anterior upwards; yellow dots indicate cardiomyocytes; white asterisks indicate endodermal holes; the number of embryos is indicated at the bottom left of the ‘donor’ panel; average endodermal width is shown at the bottom right of the ‘merge’ panel; #P<0.001 versus the corresponding control groups. Scale bars: 100 μm. |

Gα12 and Gα13 have partially redundant roles in myocardial migration. Tg(myl7:EGFP) embryos injected with gnb13ab MOs (1 ng each) and gnb12 MO (4 ng), alone or in combination, at 30 hpf. (A-C) Overlay of epifluorescence and bright-field images. Ventral view; white arrows indicate hearts. (D-F) myl7 expression, as detected by in situ hybridization. Dorsoanterior view with anterior upwards. (G) Frequencies of indicated embryos that exhibit cardia bifida at 35 hpf. Scale bars: 100 μm. |

The migration and differentiation of endodermal cells are normal at gastrula stage, in embryos defective for S1pr2/Gα13 signaling. sox17 expression was examined by in situ hybridization in control (n=28), s1pr2/mil MO- (n=28) or gnb13ab MOs-injected (n=29) embryos, at 90% epiboly (9 hpf). (A-C) Dorsal view, anterior is upwards. (A′- C′) Lateral view, dorsal is towards the right. The distribution of sox17-expressing endodermal cells appears to be normal in s1pr2 or gnb13ab morphants. Scale bars: 100 μm. |

Convergent and extension movements of the mesoderm and ectoderm are not affected by S1pr2/Gα13 signaling during zebrafish gastrulation. (A-C) Expression of ntl, as detected by in situ hybridization, at 90% epiboly (9 hpf). Dorsal view. (D-F′) Expression of hgg1 (marks prechordal plate, red), dlx3 (neural plate boundary), krox20 (rhombomeres 3 and 5), shh (midline) and deltaC (somites) detected by in situ hybridization, at the 3- to 4-somite stage (12 hpf). (D-F) Dorsoanterior view; (D′-F′) dorsal view; *, notochord; white line with double arrows indicate neural plate (np). Scale bars: 100 μm. |

Defects in S1pr2/Gα13 signaling do not induce apoptosis in the endoderm. Whole-mount TUNEL assay was performed in 17 hpf (16-somite stage) Tg(sox17:EGFP) control embryos (A-A′, n=15 ) and embryos injected with the s1pr2/mil MO (B-B′, n=15) or gnb13ab MOs (C-C′, n=15) using an apoptosis detection kit (ApopTag Red in situ apoptosis Detection Kit, Millipore) according to the manufacturer’s instructions. Rhodamine-labeled apoptotic cells (red) are not detected in the EGFP-expressing endoderm. (A-C) Lateral view with anterior towards the left; (A′-C′) dorsoanterior view with anterior upwards. Scale bars: 100 μm. |

Cardiac-specific expression of Gα13a fails to rescue cardia bifida caused by global Gα13 inhibition. The transgene myl7:gna13a-IRES-nlsGFP was created using the Gateway system (Kwan et al., 2007; Villefranc et al., 2007), such that Gα13a is expressed specifically in the myocardial cells under control of the myl7 promoter (Huang et al., 2003). The expression of Gα13a was monitored as nuclear GFP (nlsGFP) expression driven by an internal ribosomal entry site (IRES) (Kwan et al., 2007). The transgene plasmid DNA (50 pg) was co-injected with transposase RNA (30 pg) into the cytoplasm of wild-type embryos at the one-cell stage. A stable line expressing Gα13a in the heart was identified. Injections of gnb13ab MOs in Tg(myl7:gna13a-IRES-nlsGFP) embryos still exhibited cardia bifida. (A) A representative epifluorescence image of 30 hpf-Tg(myl7:gna13a-IRES-nlsGFP) embryos, showing expression of nlsGFP in the heart (arrow). (B) A confocal Z-stack image showing that nlsGFP is expressed in all cardiomyocytes of Tg(myl7:gna13a-IRES-nlsGFP) embryos at 30 hpf. (C) A representative epifluorescence image of 30 hpf-Tg(myl7:gna13a-IRES-nlsGFP) embryos injected with gna13ab MOs showing cardia bifida (arrows). (D) Frequencies of cardia bifida in 30-hpf embryos. #P>0.5 versus control. Scale bar: 100 μm. |
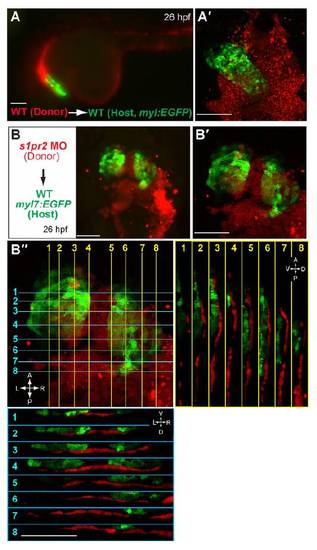
Donor cells do not contribute to myocardium when transplanted into endoderm. Epifluorescence images (A,B) and confocal z-stack images (A′,B′) showing rhodamin-dextran labeled donor cells and GFP-labeled myocardium in host embryos at 26 hpf. (A-A′) Wild-type donor cells were transplanted into wild-type hosts in the Tg(myl7:EGFP) background. (B-B′ ′) s1pr2 MO-injected donor cells were transplanted into wild-type hosts in the Tg(myl7:EGFP) background. (A) Lateral view; (A′′B,B′ ′ ventral view; (B′ ′) orthogonal view of B′ ′ Blue lines indicate cross-section planes along the L/R axis of the embryos perpendicular to the midline; yellow lines indicate cross-section planes along the embryonic AP axis; blue and yellow lines are numbered to show the position of the corresponding orthogonal panel; the respective sections are shown within blue or yellow insets. A, anterior; P, posterior; L, left; R, right; D, dorsal, V, ventral. Scale bars: 100 μm. |