
- Title
-
Inhibition of the pim1 oncogene results in diminished visual function
- Authors
- Yin, J., Shine, L., Raycroft, F., Deeti, S., Reynolds, A., Ackerman, K.M., Glaviano, A., O'Farrell, S., O'Leary, O., Kilty, C., Kennedy, C., McLoughlin, S., Rice, M., Russell, E., Higgins, D.G., Hyde, D.R., and Kennedy, B.N.
- Source
- Full text @ PLoS One

Maturation of visual function and correlations to gene expression in larval zebrafish. (A) The morphology of the zebrafish retina shows no significant changes from 3–5 dpf. However, the OKR (B) and the VMR (C) show significant increases in the number of eye saccades or the amplitude of locomotor responses to light changes from 3–5 dpf. Lights on is shown as a yellow bar below the diagram, and lights off is shown as a black bar. (D–H) Overview of microarray results of eye gene expression for 3, 4 and 5 dpf zebrafish eyes. (D) Hierarchical clustering of gene expression was based on normalized signals (z-scores) using the correlation similarity metric and average linkage clustering. (E) Venn diagram showing the number of up-regulated and down-regulated transcript-level probe sets between pairwise comparisons using the limma Bayesian model based t-test. (F–H) Log2 transformed signal intensities of probe sets are depicted as dots, with up-regulated probe sets in red and down-regulated sets in green. |
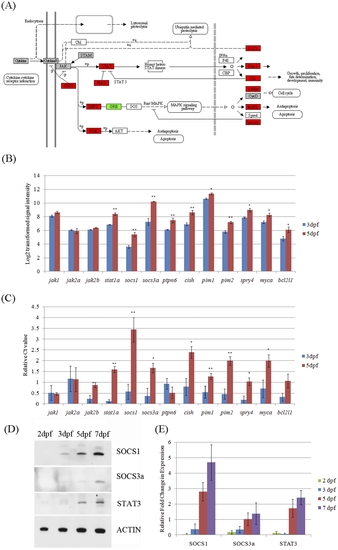
Up-regulation of gene and protein expression in the Jak-Stat signaling pathway from 3 to 5 dpf during eye development. (A) Red blocks are up-regulated genes between 5 versus 3 dpf. Green blocks are down-regulated genes between 5 versus 3 dpf. Grey blocks are genes not changed between 5 versus 3 dpf. White blocks are genes not targeted by the microarray or not in the zebrafish genome. The gene interaction network figure is from the KEGG database with modification adapted to zebrafish genes. (B) Signal intensities on the microarrays. *: q-value<0.05. **: q-value<0.01. (C) Real-time PCR results are depicted as relative abundance compared to lowest abundance sample. *: p-value<0.05. **: p-value<0.01. (D) Western blot and (E) densitometric analysis of protein samples extracted from zebrafish whole larvae shows that Socs1, Socs3a and Stat3 expression are up-regulated from 2 to 7 dpf. |

Socs3a, Socs1 and Stat3 expression in 2–7 dpf retina. First five panels are immunohistochemical analysis showing increasing expression of Socs3a, Socs1 and Stat3 throughout the retina from 2–7 dpf. Minimal staining is observed in secondary antibody alone, pre-immune serum or morphant controls. The last three panels are in-situ hybridisations of socs3a, socs1 and stat3 genes on 2 and 7 dpf. No significant staining was observed in sense probe controls. GCL, ganglion cell layer; INL, inner nuclear layer; ONL, outer nuclear layer. |

Cell types in Socs1, Socs3a and Stat3 morphant retinae. Socs1, Socs3a and Stat3 morphant retinae were labelled with rhodopsin for photoreceptors, gfap:GFP for Muller glia, Hu for inner retinal neurons and TUNEL staining for apoptotic cells. Scale bar in the upper left panel represents 50 microns and is the same for all the panels. |
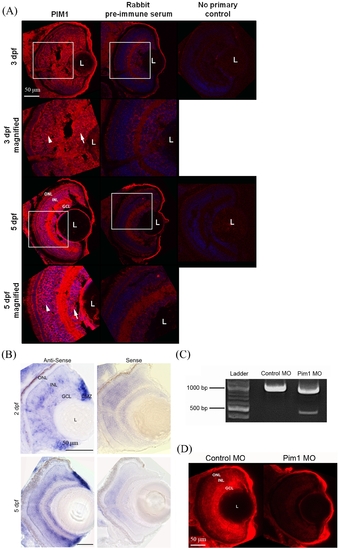
Localisation of Pim1 in the larval eye. (A) Immunohistochemical analysis of Pim1 protein (red) and DAPI (blue) in 3 and 5 dpf larval eyes reveals Pim1 expression throughout the neuoretina including the ganglion cell layer (arrow) and inner nuclear layer (arrowhead) at both timepoints. (B) Pim1 RNA is expressed in the INL, GCL and CMZ of 2 and 5 dpf larvae. (C) RT-PCR amplification of pim1 from 5 dpf cDNA results in a 1059 bp band in control morpholino-injected larvae and a second ~500 bp band in pim1 splice site morpholino-injected larvae consistent with knockdown of pim1.(D) Pim1 expression is present in the ONL, INL and GCL of 5 dpf larvae injected with 0.025 mM standard control morpholino but highly reduced in 5 dpf larvae injected with 0.025 mM pim1 morpholino. White boxes indicate the areas magnified. MO, morpholino; ONL, outer nuclear layer; INL, inner nuclear layer; GCL, ganglion cell layer; CMZ, ciliary marginal zone; L, lens. |
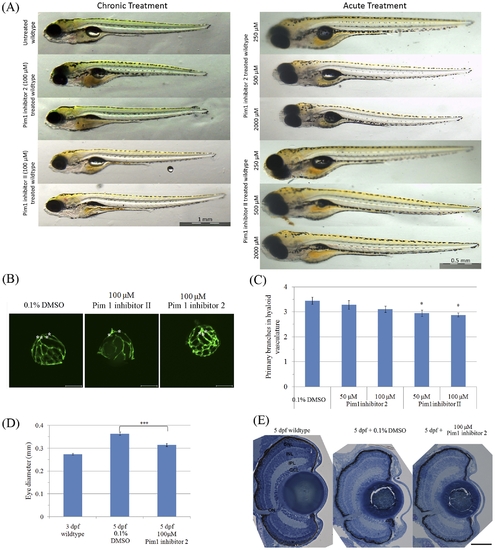
Larvae treated with Pim1 inhibitors have a slightly reduced number of primary hyaloid vessels and eye size. (A) Representative images of whole zebrafish larvae treated using Pim1 inhibitors. (B) and (C) zebrafish (n = 17 to 20) treated with Pim1 inhibitor 2 from 3–5 dpf have normal hyaloid vasculature morphology, while treatment with Pim1 inhibitor II from 3–5 dpf slightly reduces the number of primary hyaloid vessels. Primary hyaloid vessels are pointed using asterisks. P-value was calculated using one way ANOVA with Dunnett′s correction for multiple comparisons. *:ANOVA p<0.05. (D) Zebrafish larvae treated with Pim1 Inhibitor 2 from 3–5 dpf have a smaller eye. ***: Student′s t test p<0.001. (E) Retinal lamination appears normal in the larvae with drug-treated from 3–5 dpf. Scale bars are 1 mm (A) and 50 mm (E). PHENOTYPE:
|

ZFIN is incorporating published figure images and captions as part of an ongoing project. Figures from some publications have not yet been curated, or are not available for display because of copyright restrictions. PHENOTYPE:
|
|
ZFIN is incorporating published figure images and captions as part of an ongoing project. Figures from some publications have not yet been curated, or are not available for display because of copyright restrictions. PHENOTYPE:
|