
- Title
-
In vivo monitoring of cardiomyocyte proliferation to identify chemical modifiers of heart regeneration
- Authors
- Choi, W.Y., Gemberling, M., Wang, J., Holdway, J.E., Shen, M.C., Karlstrom, R.O., and Poss, K.D.
- Source
- Full text @ Development
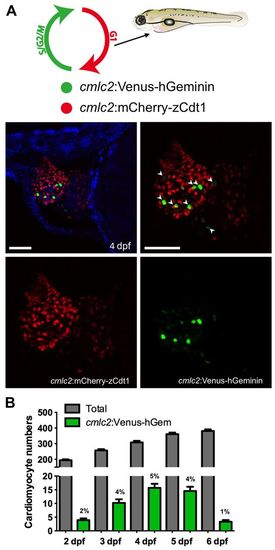
FUCCI zebrafish for visualizing cardiomyocyte proliferation. (A) Representative maximum intensity projection of the heart of a 4 dpf cmlc2:FUCCI transgenic larva, visualizing non-proliferating (cmlc2:mCherry-zCdt1, red) and proliferating (cmlc2:Venus-hGeminin, green) cardiomyocytes, as depicted in the schematic at the top. Cardiomyocytes with only the Venus-hGeminin signal (arrowheads) were considered to be proliferating. DAPI, blue. Scale bars: 50 μm. (B) Time course of total (red+ and green+) and proliferating (green+) cardiomyocytes from 2 to 6 dpf. Percentages of proliferating cardiomyocytes are indicated above bars. Data are represented as mean±s.e.m. n=13-24 embryos per stage. EXPRESSION / LABELING:
|

Hedgehog and Igf signaling promote embryonic cardiomyocyte proliferation in zebrafish. (A) Small molecule screen to identify signaling pathways that affect cardiomyocyte (CM) proliferation between 3 and 4 dpf. Green bars, drugs that were identified as potential enhancers of proliferation; red bars, drug that was identified as a potential inhibitor. Data are represented as mean±s.e.m. n=8-12 embryos per condition. In the schematic, green and red circles represent proliferating and non-proliferating cells, respectively. (B) Representative maximum intensity projections of 4 dpf cmlc2:FUCCI embryos treated with Smoothened agonist (SAG) or the Igf agonist NBI-31772. Scale bars: 50 μm. Anterior is to the left in images. (C) Effects of treatments with SAG (5 μM), CyA (5 μM), NBI-31772 (2.5 μM), NVP AEW541 (5 μM) and SB-431542 (5 μM) on cardiomyocyte proliferation signals. n=30-48, mean±s.e.m. *P<0.005, Student′s t-test. Experiments for an individual graph were performed on a combined pool of embryos. Proliferation indices could vary between pools used for each individual graph. (D) Changes in proliferation were reflected by analogous changes in the total number of cardiomyocytes in cmlc2:nucDsRed2 embryos at 4 dpf. n=23-35, mean±s.e.m. *P<0.05, Student′s t-test. |

Hedgehog, Igf and Tgfβ signaling are required for myocardial regeneration in zebrafish. (A) The Shh ligand shha (transgenic reporter) and regulator/response gene ptch2 (transgenic reporter), Igf ligand igf2b (in situ hybridization) and receptor Igfr1 (immunofluorescence), and Tgfβ ligand tgfb3 (in situ hybridization) each showed increased expression in the wound area by 7 dpa. Brackets indicate injury site. Scale bar: 100 μm. (B) Treatment with CyA (10 μM) or NVP AEW541 (2 μM) from 6 to 7 dpa decreased cardiomyocyte proliferation. Mef2, red; PCNA, green. Brackets indicate injury site. Insets: High magnifications of the boxed areas. Arrowheads indicate proliferating cardiomyocytes. Scale bar: 50 μm. (C) Quantification of the effects of CyA (10 μM), NVP AEW541 (2 μM) and SB-431542 (10 μM) on cardiomyocyte proliferation after resection injury. Fish were treated from 6 to 7 dpa. n=9-15, mean±s.e.m. *P<0.01, Student′s t-test. (D) Quantification of the effects of CyA, NVP AEW541 and SB-431542 on proliferation after genetic cardiomyocyte ablation. Fish were treated from 6 to 7 dpa. n=12-13, mean±s.e.m. *P<0.001, Student′s t-test. Data in each graph were obtained from different clutches of fish. EXPRESSION / LABELING:
|
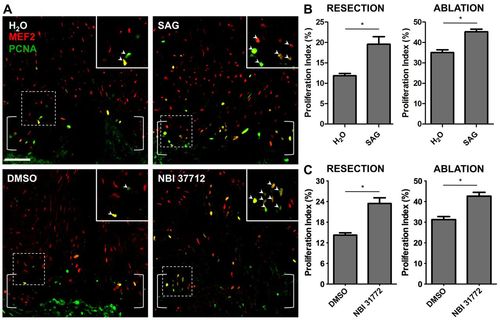
Hedgehog or Igf pathway activation increases cardiomyocyte proliferation during regeneration in zebrafish. (A) Treatment with SAG (2.5 μM) or NBI-31772 (10 μM) from 6 to 7 dpa increased cardiomyocyte proliferation. Mef2, red; PCNA, green. Brackets indicate injury site. Insets: High magnification of the boxed areas. Arrowheads indicate proliferating cardiomyocytes. Scale bar: 50 μm. (B) Quantification of cardiomyocyte proliferation following treatment with SAG (2.5 μM) after resection (left) or ablation (right) injury models. Fish were treated from 6 to 7 dpa. n=9-15, mean±s.e.m. *P<0.01, Student′s t-test. (C) Quantification of cardiomyocyte proliferation following treatment with NBI-31772 after resection (10 μM) or ablation (5 μM) injury models. n=11-17, mean±s.e.m. *P<0.05, Student′s t-test. |
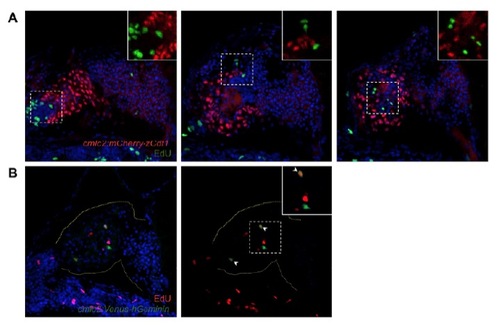
Co-staining of cardiac FUCCI expression with EdU incorporation. (A) Cells expressing the cmlc2:mCherry-zCdt1 transgene (red) do not overlap with cells containing incorporated EdU (green). Images are representative maximum intensity projections from the same heart. DAPI, blue. Inset: High magnification of the boxed area. (B) A subset of cells expressing the cmlc2:Venus-hGeminin transgene (green) also contain incorporated EdU (red). DAPI, blue. Inset: High magnification of the boxed area. Arrowheads, co-expressing cells; dotted yellow line, outline of the heart. Note that many EdU+ cells in these images are not cardiomyocytes. |
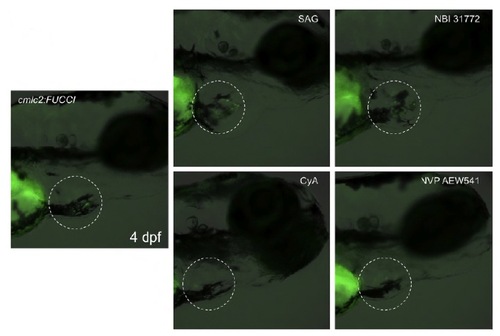
Effects of drug treatment on cardiomyocyte proliferation can be visualized in live embryos with a stereomicroscope. cmlc2:FUCCI embryos treated with the indicated drugs from 3 to 4 dpf, exhibiting signal changes detectable via the green channel (dashed area). cmlc2:Venus-hGeminin, green. Bright-field image is overlaid. |
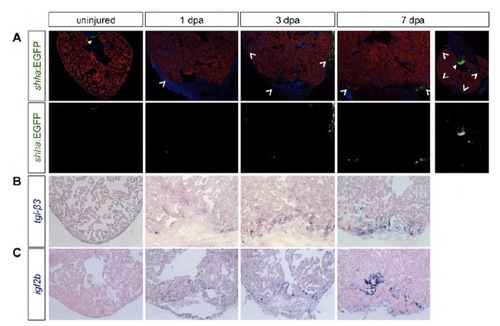
Complete time course panel of ligand expression. (A) shha regulatory sequences drive EGFP in the valves of uninjured hearts, and is upregulated in patchy areas (arrowheads) of the epicardium at 1 and 3 dpa. By 7 dpa, expression is detected in epicardial cells within the injury, as well as more globally in the epicardium surrounding the heart. Top: shh:EGFP, green; Myosin heavy chain, red; DAPI, blue; notched arrowheads, shh:EGFP expression; filled arrowheads, valve expression. Bottom: shh:EGFP expression. (B) tgfb3 expression is detectable at low levels in the myocardium by 1 and 3 dpa and localizes to the injury site by 7 dpa. (C) After injury, the ligand igf2b is expressed in endocardial cells, and at lower levels in epicardial tissue, near the injury site. |
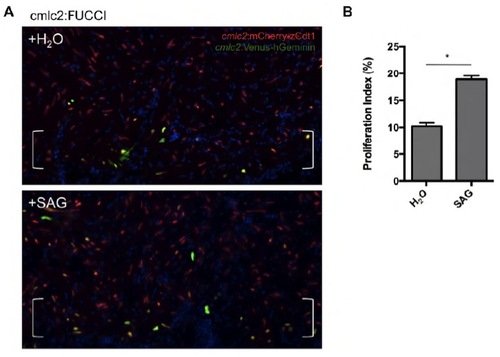
Cardiomyocyte proliferation can be visualized in adult cmlc2:FUCCI hearts. (A) Treatment with SAG (2.5 mM) from 6 to 7 days after resection injury increased levels of Venus-hGeminin+ cardiomyocytes. cmlc2:mCherry-zCdt1, red; cmlc2:VenushGeminin, green. Brackets indicate injury site. (B) Quantification of the effects of SAG treatment, using cmlc2:FUCCI fish. n=6, mean±s.e.m. *P<0.00001, Student’s t-test. |