
- Title
-
Inflammatory Chemokines Direct and Restrict Leukocyte Migration within Live Tissues as Glycan-Bound Gradients
- Authors
- Sarris, M., Masson, J.B., Maurin, D., Van der Aa, L.M., Boudinot, P., Lortat-Jacob, H., and Herbomel, P.
- Source
- Full text @ Curr. Biol.
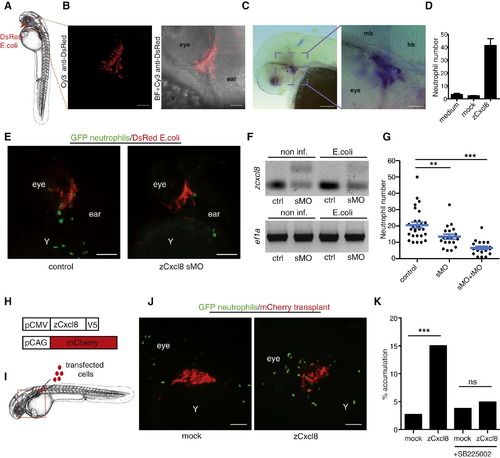
zCxcl8 Is Necessary and Sufficient to Instruct Neutrophil Migration(A) Diagram of zebrafish larva at 2 dpf. Arrow indicates site of E. coli injection. Square denotes area viewed in (B).(B) DsRed-expressing E. coli was detected by immunofluorescence at 2 hr postinfection (hpi). Fluorescence is shown alone or overlaid on bright-field image (BF). Scale bars represent 25 μm.(C) In situ hybridization of zcxcl8 mRNA at 2 hpi. Scale bars represent 100 μm (left) and 20 μm (right). mb, midbrain; hb, hindbrain.(D) In vitro chemotactic response of adult zebrafish neutrophils to conditioned media from zCxcl8 or mock-transfected HEK293T cells, in a transwell assay. Number of transmigrated neutrophils was measured by flow cytometry and normalized to the same number of calibration beads. Data are means of triplicate samples, representative of four experiments. Error bar represents SEM.(E) SDCM images of neutrophils within live larvae treated or not treated with splice-blocking zcxcl8 morpholino (sMO) at 1 hpi. Y, yolk sac. Scale bars represent 100 μm.(F) RT-PCR of zcxcl8 mRNA, from larvae treated or not treated with splice-blocking zcxcl8 morpholino (sMO), performed at 2 hpi. ef1a is a loading control.(G) Neutrophil recruitment to E. coli in larvae treated or not treated with splice (sMO) or combined splice and translation-blocking (sMO+tMO) zcxcl8 morpholinos, quantified at 2 hpi (control: n = 29 larvae; sMO: n = 19; sMO+tMO: n = 20 larvae, three independent experiments). Error bars indicate SEM. p < 0.01; p < 0.0001 (Mann-Whitney test).(H) zCxcl8-V5 and mCherry expression constructs.(I) Transplantation site of transfected HEK293T cells. The square indicates the area imaged.(J) SDCM images of neutrophils within live larvae 1 day after transplantation with mCherry-transfected HEK293T cells, cotransfected (zCxcl8) or not cotransfected (mock) with zCxcl8. Y, yolk sac. Scale bars represent 100 μm.(K) Percentage of neutrophil tracks reaching the transplant out of all tracks in the imaged area. Mock: n = 568; zCxcl8: n = 1,378; mock+SB225002: n = 156; zCxcl8+SB225002: n = 182. p < 0.0001 (Fisher′s exact test for cells reaching or not transplant). Data are pooled from three to four larvae per group originating from two or three independent experiments.See also Figure S1 and Movie S1. |

zCxcl8 Imposes an Orthotactic Bias on Neutrophil Random Walk(A) Evolution of the propagator, i.e. the probability density function (Pdf) of neutrophil displacement r(t) at different times t, in larvae with mock or zCxcl8 transplants. Points are the results of the experiments and lines are Gaussian fits. Colors are associated with times: black for t = 1 min, red for t = 2 min, green for t = 4 min, blue for t = 8 min, and cyan for t = 16 min. Plots are in log-log scale. Insets are the collapsed curves, P(ρ), into a unique Gaussian. Black line is the Gaussian fit. Data are from four larvae in four experiments.(B and E) Left panels: representative SDCM images of neutrophils (green) within the area of transplanted cells (red). Representative 50 × 50 × 50 μm cubes indicate example areas covering <100–200 μm (B) or <100 μm (E) distance from transplant, such as were used for motility analysis shown in (C) and (D) and in (F) and (G), respectively. E, eye; Y, yolk sac. Scale bars represent 100 μm. Right panels: tracks of neutrophils within the indicated representative cube. Blue arrows indicate the direction toward the transplant.(C and F) Proportion of tracks within <100–200 μm or <100 μm from the transplant, respectively, that moved toward the transplant. For (C), mock: n = 141, zCxcl8: n = 109; for (F), mock: n = 155; zCxcl8: n = 154 (Fisher′s exact test for tracks moving toward or away from transplant).(D and G) Straightness (displacement/path length) of tracks within ~100–200 μm or <100 μm from transplant, respectively, that migrated toward the transplant. For (D), mock n = 68; zCxcl8: n = 60; for (G), mock: n = 71; zCxcl8: n = 95 (Mann-Whitney test). Error bars indicate SEM. ns, not significant; p < 0.05; p < 0.01.(H) Approach angle θ toward transplant for neutrophil steps made in time interval, δt = 30 s.(I) Average approach angles for individual neutrophil steps. Mock: n = 2,585; zCxcl8: n = 2,138 (Mann-Whitney test). Error bars indicate SEM. ns, not significant.(J) Average time during which a cell maintained orientation toward (θ < 90°) the transplant. zCxcl8: n = 380; mock: n = 500. (Mann-Whitney test). ns, not significant.(K) Average speed of neutrophil steps with approach angles to the transplant <45°. Mock: n = 702; zCxcl8: n = 564 (Mann-Whitney test). Error bars indicate SEM. p < 0.0001.Pooled data from several cubes in three larvae per case, from three independent experiments, are shown in (C), (D), (F), (G), and (I)–(K). See also Figure S2. |
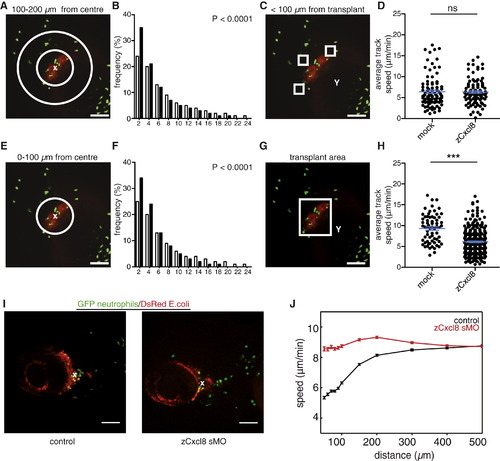
zCxcl8 Locally Restricts Neutrophil Motility(A and E) SDCM example image of neutrophils (green) within the area of transplanted mCherry/zCxcl8 cotransfected cells (red). Areas between circles indicate zones at different distances from transplant center (indicated with a white x) that were used for the motility analysis shown in (B) and (F).(B and F) Distribution of instantaneous speed of individual neutrophil steps in the presence (black bars; n = 16,138 for B; n = 13,646 for F) or absence (white bars; n = 9,486 for B; n = 3,234 for F) of zCxcl8 (two-tailed chi-square test). Data were binned every 2 μm/min.(C and G) SDCM example images of neutrophils (green) within the area of transplanted mCherry/zCxcl8 cotransfected cells (red). Representative cubes indicate example areas at different distances from transplant, such that were used for motility analysis shown in (D) and (H), respectively.(D and H) Average track speed in the presence or absence (mock) of zCxcl8. For (D), mock: n = 92, zCxcl8: n = 97; for (H), mock: n = 66, zCxcl8: n = 290 tracks (Mann-Whitney test). Y, yolk sac. ns, not significant; p < 0.0001.(I) Representative images of larvae infected with E. coli and treated or not with zCxcl8 sMO. x, center of infection.(J) Evolution of neutrophil speed with the distance from the center of the infection site.For (D), (H), and (J) error bars indicate SEM. For (B), (F), (D), (H), and (J), data are pooled from three to four larvae per case in three or four experiments. For (A), (C), (E), (G), and (I), scale bars represent 100 μm. See also Figure S3 and Movies S2 and S3. |

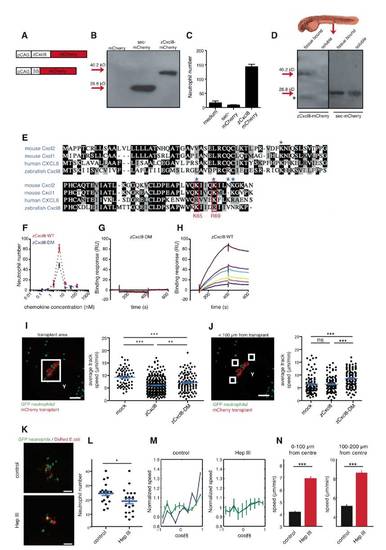
zCxcl8 Directs and Restricts Neutrophil Motility as HSPG-Bound Gradients(A–I) Extracellular distribution of sec-mCherry (A–C), zCxcl8-mCherry (D–F), and zCxcl8-DM-mCherry (G–I) secreted from transplanted cells. Top: 3 dpf larvae. Squares indicate imaged regions.(A, D, and G) Projections of confocal image stacks showing immunodetection of sec-mCherry, zCxcl8-mCherry, and zCxcl8-DM-mCherry at the site of secretion. Left: grayscale images with green dotted lines outlining the secreting cells. Right: same images color coded for fluorescence intensity.(B, E, and H) Quantification of mCherry staining as a function of the distance from the nearest producing cell. Fluorescence intensity signals along various lines starting from the implants is shown. Colors are associated to different larvae, thin curves are the intensity evolutions along individual lines, and thick curves are the average of the thin curves. Data are from six or seven larvae in two or three independent experiments.(C, F, and I) Projections of confocal image stacks showing immunodetection of sec-mCherry, zCxcl8-mCherry, and zCxcl8-DM-mCherry in the vasculature. CA, caudal artery; CVP, caudal vein plexus; dCV, definitive caudal vein. Data are representative of six or seven larvae in two or three independent experiments. For (A), (C), (D), (F), (G), and (I), scale bars represent 25 μm.(J) Percentage of neutrophil tracks reaching transplanted cells expressing or not expressing zCxcl8 or zCxcl8-DM. Mock: n = 568; zCxcl8: n = 1,378; zCxcl8-DM: n = 772 (Fisher′s exact test for tracks reaching or not transplant). p < 0.0001.(K) Evolution of the average normalized speed with the orientation of motion (cosine of the angle θ, with θ = 0 the direction of the transplant center) within a radius of 150 μm from the transplant center. Speed values are normalized by the average value of the speed, to allow comparison across different experiments. Data are from four larvae in two to four independent experiments. Error bars indicate SEM.(L) Average speed of neutrophil steps inside a radius of 100 μm (left) and between radii of 100 μm and 200 μm (right). Mock: n = 2,293 (left) and n = 6,924 (right); zCxcl8: n = 9,208 (left) and n = 14,375 (right); zCxcl8-DM: n = 3,269 (left) and n = 6,589 (right). Data are from four larvae in two to four independent experiments (Mann-Whitney test). Error bars indicate SEM. p < 0.0001.See also Figure S4 and Movie S4. |

zcxcl8 Is Upregulated upon Infection, and zcxcl8 Knockdown Does Not Affect Larval Development or Neutrophil Distribution (Related to Figure 1) |

zCxcl8 Imposes an Orthotactic Bias on Neutrophil Random Walk (Related to Figure 2) |
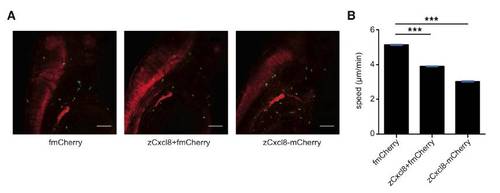
zCXCL8 Overexpression Inhibits Neutrophil Motility (Related to Figure 3) |
zCxcl8 Guides Neutrophils as HSPG-Bound Gradients (Related to Figure 4) |