
- Title
-
Life-long preservation of the regenerative capacity in the fin and heart in zebrafish
- Authors
- Itou, J., Kawakami, H., Burgoyne, T., and Kawakami, Y.
- Source
- Full text @ Biol. Open

Comparable regeneration of the caudal fin in young and old zebrafish. (A–F′) The caudal fin prior to amputation (A,D), immediately after amputation (B,E) and 13 days after amputation (C,C′,F,F′) in young (A–C′) and old (D–F′) fish. C′ and F′ show close ups of the boxed areas in C and F, respectively. Dashed lines in A and D indicate the amputation lines. Arrows in C and F indicate the levels of amputation in the regenerated fin, which is visible by the altered pigmentation pattern. Scale bar: 5mm; the degree of zoom: ×5. (G,H) Schematic representations of the measured regenerative length at the center (G) and near the dorsal edge (H) of the regenerating fin. The angles between the measured lines along the dorsal edge and the center were 25.1±2.9 degrees and 27.1±4.7 degrees in young and old fish, respectively. The graphs show recovery ratio at indicated time-points from amputation in young and old fish. |

Regeneration of the myocardial layer and induction of Gata4 expression in young and old fish hearts. (A-F′) MHC staining of regenerating hearts at 7 dpa (A–B′), 14 dpa (C–D′) and 30 dpa (E-F′) in young (A,A′,C,C′,E,E′) and old (B,B′,D,D′,F,F′) fish. A′-F′ show higher magnification images of the boxed areas in A-F. Open arrowheads indicate MHC signals in the regenerating area. For simplicity, not all signals are pointed. Scale bar: 50 μm; the degree of zoom: ×5.5. (G,H) Gata4 immunoreactivity was not detected immediately after amputation. H shows a close up of the boxed areas in G. Scale bar: 50 μm; the degree of zoom: ×2. (I-J′) Gata4 staining of regenerating hearts at 7 dpa in young (I,I′) and old (J,J′) fish. Black arrowheads indicate Gata4 signals. I′ and J′ show close ups of the boxed areas in I and J. Sections were counterstained with hematoxylin. Dotted lines indicate the amputated planes of 7 and 14 dpa hearts. Brackets indicate the regenerating areas of 30 dpa hearts. Scale bar: 50μm; the degree of zoom: ×2. |
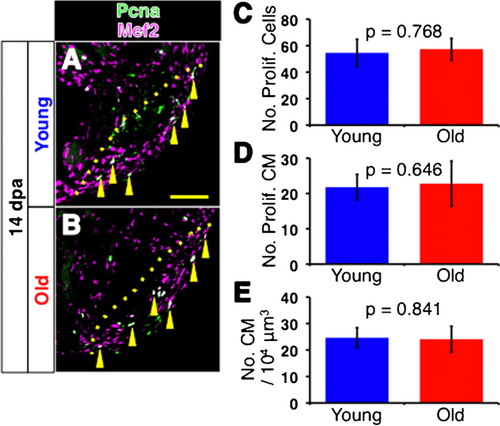
Cell proliferation in regenerating young and old fish heart. (A,B) Immunofluorescence images for Pcna (green) and Mef2 (magenta) of 14 dpa young (A) and old (B) fish hearts. Yellow arrowheads point to Pcna and Mef2 double positive, proliferating cardiomyocytes (shown as white signal). For simplicity, not all proliferating cardiomyocytes are pointed. Dotted lines indicate the amputated planes. Scale bar: 50μm. (C,D) Number of Pcna-positive proliferating cells per section (C), and Pcna-Mef2 double positive proliferating cardiomyocytes per section (D) of young and old fish hearts at 14 dpa. (E) Densities of cardiomyocytes in the regenerating area in 14 dpa hearts. The p-values between young and old fish are shown. Same slides were examined for C, D and E. |

Comparable vascularization and activation of FGF signaling in regenerating hearts of young and old fish. (A-D) Fluorescent images of fli1:EGFP signals of regenerating young (A,C) and old (B,D) fish hearts at 7dpa (A,B) and 14 dpa (C,D). Arrowheads point to the fli1:EGFP signals in the regenerating area. DAPI was used for counterstaining. In C and D, not all signals were labeled for simplicity. (E-F′) fli1: EGFP signals in the uninjured heart (E,E′) and in regenerating heart (F,F′) at 14 dpa in young fish. The signals were detected as small clusters throughout the heart. In the regenerating area, the fli1: EGFP signals formed larger clusters than those in uninjured area. E′ and F′ are close up images of the boxed areas in E and F, respectively. Scale bar: 50 μm; the degree of zoom: ×2. (G) Degree of vascularized areas in the regenerating and uninjured areas. The degree was quantified by the ratio of fli1:EGFP signal-positive area in the regenerating area and the uninjured area from single confocal plane. The p-values between young and old fish are shown. (H-I′) Immunofluorescence images of pErk1/2 (magenta) and MHC (green). Closed and open arrowheads point to the pErk1/2 positive signals at the surface of the heart and inside the regenerating area, respectively. H′ and I′ show close ups of the boxed areas in H and I. Scale bar: 50 μm; the degree of zoom: ×4. (J-K′) Immunofluorescence images of mkp3: EGFP (magenta) and MHC (green). Arrowheads point to the mkp3: EGFP signal positive signals at the surface of the heart and inside the regenerating area, respectively. J′ and K′ show close ups of the boxed areas in J and K. Dotted lines indicate the amputated planes. Scale bar: 50μm; the degree of zoom: ×4. |

Comparable expression of epicardial genes in regenerating hearts of young and old fish. (A-F) In situ hybridization of wt1b immediately after amputation at 0 dpa (A,B), at 3 dpa (C,D) and at 7 dpa (E,F) in regenerating hearts of young (A,C,E) and old (B,D,F) fish. Arrowheads point to the wt1b signals. (G-H′) in situ hybridization of aldh1a2 at 3 dpa in the regenerating hearts of young (G,G′) and old (H,H′) fish. Black arrowheads and open arrowheads point to the aldh1a2 signals in the epicardial tissue and endocardial tissue, respectively. G′ and H′ shows close up images of the boxed areas in G and H. Dotted lines indicate the amputated planes. Scale bar: 50μm; the degree of zoom: ×2. |