
- Title
-
A new zebrafish bone crush injury model
- Authors
- Sousa, S., Valerio, F., and Jacinto, A.
- Source
- Full text @ Biol. Open

Differences in tissue architecture after crush and amputation induced regeneration in the same caudal fin. (A–C) Bright filed image of a caudal fin after crush and cut at (A) 24hpc/a and (B) 10dpc/a. (C) Magnification of the inset in picture B. (D) Alizarin Red staining for bone matrix at 48hpc; dashed lines indicates the region of callus formation that is not stained with Alizarin Red. (E) Bright field confocal image of 48hpc injury site, the arrow highlights the callus structure. (F) Hematoxilin/Eosin staining in a transversal section of a 48hpc ray. Arrowheads indicate the amputation plane and asterisks indicate crush injury area in A and B, and crush injury sites in C and D. Scale bar corresponds to 500μm in A and B, 200μm in C, 100μm in D and 50µμm in E and F. (hpa – hours post-amputation; hpc – hours post-crush injury). |

Presence of wound healing marker genes after crush injury. (A) Immunohistochemistry for p63 (green) in 24hpc transversal section of caudal fin. Blue represents DAPI positive nuclei. The arrow indicates an intact bony ray and the asterisk the site of crush injury. (B–M) Whole-mount in situ hybridization for mRNA of (B–E) pea3 at (B) 24hpc (C) 24hpa (D) 48hpc (E) 48hpa; (F–I) lef1 at (F) 24hpc (G) 24hpa (H) 48hpc (I) 48hpa; (J–M) junb at (J) 24hpc (K) 24hpa (L) 48hpc (M) 48hpa. Arrowheads indicate the amputation plane and asterisks indicate crush injury sites. Scale bar corresponds to 50μm in A and 200μm in B–M. (hpa – hours post-amputation; hpc – hours post-crush injury). |
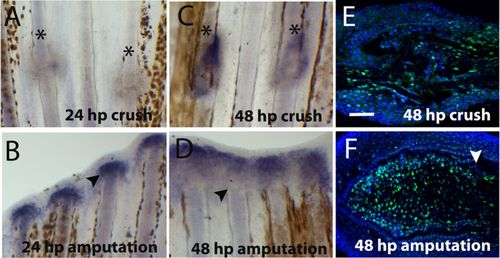
Blastema marker, msxb, and proliferation after crush injury. (A–D) Whole-mount in situ hybridization for msxb mRNA at (A) 24hpc (B) 24hpa (C) 48hpc (D) 48hpa. Immunohistochemistry for the proliferation marker PCNA (green) at (E) 48hpc around the crush injury site and (F) 48hpa blastema (distal region is to the left and proximal to the right). DAPI (blue) is staining the nuclei. Arrowheads indicate the amputation plane and asterisks indicate crush injury sites. Scale bar corresponds to 100μm. (hpa – hours post-amputation; hpc – hours post-crush injury). |

Expression of skeletogenesis genes after crush injury. (A–L) Whole mount in situ hybridization for mRNA detection of (A–D) osterix at (A) 24hpa; (B) 24hpc (C) 48hpa (D) 48hpc; (E–H) collagen I at (E) 24hpa (F) 24dpc (G) 48hpa (H) 48hpc; (I–L) osteonectin at (I) 24hpa (J) 24hpc (K) 48hpa (L) 48hpc. Arrowheads indicate the amputation plane and asterisks indicate crush injury sites. Scale bar corresponds to 100μm in all panels. (hpa – hours post-amputation; hpc – hours post-crush injury). |
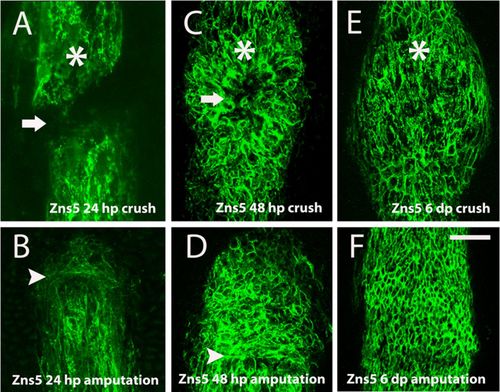
Skeletal cell deposition was delayed and patterning was affected after crush injury. (A–F) Immunohistochemistry with the antibody anti-Zns5 to detect skeletal cells. (A) 24hpc, the arrow highlights the lack of bone cells deposition (B) 24hpa (C) 48dpc (D) 48hpa (E) 6dpc (F) 6dpa, near the amputation plane. Arrowheads indicate the amputation plane and asterisks indicate crush injury sites. Scale bar corresponds to 50µm in all panels. (hpa – hours post-amputation; hpc – hours post-crush injury). |
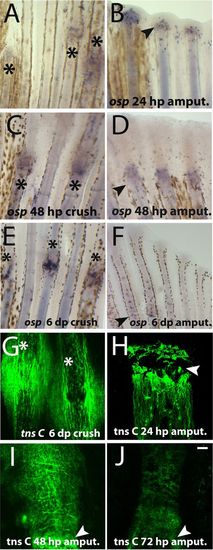
Bone was undergoing repair 6 days post-crush injury. (A–F) Whole mount in situ hybridization for osteopontin mRNA. (A) 24hpc (B) 24hpa (C) 48hpc (D) 48hpa (E) 6dpa (F) 6dpc. (G–J) Whole mount immunofluorescense for Tenascin C at crush injury sites 6dpc. Arrowheads indicate the amputation plane and asterisks indicate crush injury sites. Scale bar corresponds to 100μm in all panels. (hpa – hours post-amputation; hpc – hours post-crush injury). |
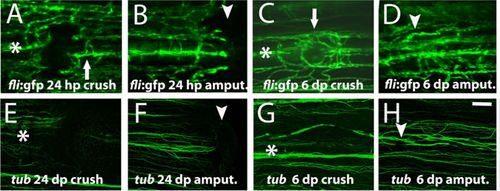
Blood vessels structure was compromised, whereas nerve bundles were not after crush injury. (A–D) Imaging of the transgenic line fli:EGFP that labels the endothelial cells at (A) 24hpc, arrow indicates the main bony ray artery (B) 24hpa (C) 6dpc, arrow highlights the blood vessels mispatterning (D) 6dpa. (E–H) Immunohistochemistry with the antibody anti-acetylated Tubulin to detect nerve fibres at (E) 24hpc (F) 24hpa (G) 6dpc (H) 6dpa. Arrowheads indicate the amputation plane and asterisks indicate crush injury sites. Scale bar corresponds to 100μm in all panels. (hpa – hours post-amputation; hpc – hours post-crush injury; dpa – days post-amputation; dpc – days post-crush injury). |