
- Title
-
Failure in closure of the anterior neural tube causes left isomerization of the zebrafish epithalamus
- Authors
- Lu, P.N., Lund, C., Khuansuwan, S., Schumann, A., Harney-Tolo, M., Gamse, J.T., and Liang, J.O.
- Source
- Full text @ Dev. Biol.

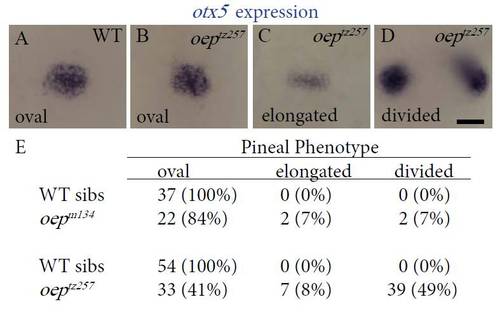
flh is expressed in embryos with an open neural tube. In (A, E) WT and (B, F) sqt mutant embryos with closed neural tubes, the pineal precursors (p, white arrowheads) form a single, oval domain that spans the dorsal midline (dotted lines) separating the left (L) and right (R) sides of the epithalamus. (C) In sqt embryos with mild open neural tube defects, the pineal precursors still span the dorsal midline of the brain, but the pineal anlage is elongated along the left–right axis. (D, G, H) In sqt and cyc; sqt embryos with a severe open neural tube phenotypes, the pineal precursors are present in two divided domains on the left and right sides of the brain. Dorsal views of the epithalamus in (A–D) live or (E–H) fixed embryos, anterior to the top. Scale bar=20 μm. EXPRESSION / LABELING:
PHENOTYPE:
|
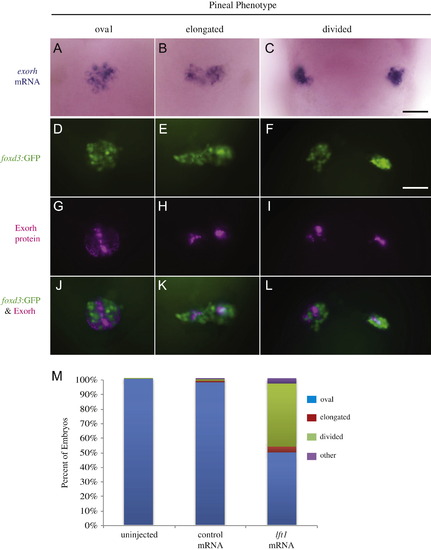
Projection neuron and photoreceptor differentiation occurs in the pineal glands of Lft1 overexpressing embryos with open neural tubes. ((A)–(C)) The photoreceptor specific gene exorh is expressed in embryos with all three pineal phenotypes (n=21 oval, n=2 elongated, n=6 divided). ((D)–(L)) Embryos were analyzed for both foxd3:GFP transgene expression and Exorh protein expression, and representative embryos with an oval pineal ((D), (G) and (J)), with an elongated pineal ((E), (H) and (K)), and a divided pineal ((F), (I) and (L)) are shown. ((D)–(F)) are images of the foxd3:GFP expression, ((G)–(I)) are images of the Exorh immunostaining, and ((J)–(L)) are overlays of the two expression patterns. Note that in ((J)–(L)), foxd3:GFP and Exorh are expressed in distinct regions of the pineal, suggesting the foxd3:GFP transgene is primarily found in pineal projection neurons at this stage of development (n=36 oval, n=4 elongated, n=11 divided). (M) Percentage of lft1 mRNA injected embryos expressing the foxd3:GFP transgene in an oval pattern (closed anterior neural tube), or elongated or divided pattern (open neural tube). n>120 embryos. All embryos were at 48 hpf. All images are dorsal views, anterior to the top. Scale bars=25 μm. |
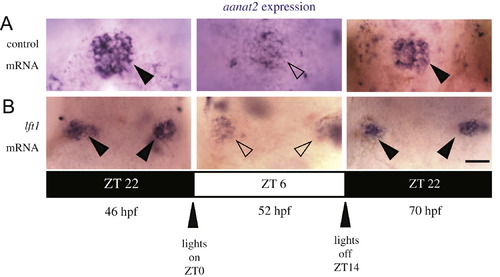
Rhythmic expression of aanat2 is initiated in pinealocytes of embryos with open neural tubes. Dorsal views of embryos raised in 14:10 h light:dark cycle fixed at indicated time points. (A) GFP mRNA injected control embryos with oval pineal glands. (B) lft1 mRNA injected embryos with divided pineal glands. Closed arrowheads indicate pineals with high aanat2 expression; open arrowheads indicate pineals with low aanat2 expression. ZT indicates time within the circadian cycle, lights turning on at ZT=0 and lights turning off at ZT=14. Dark bars indicate lights off and light bars indicate lights on. For each time point, ne10 for embryos with oval shaped pineal and embryos with divided pineal. Scale bar=25 μm. |
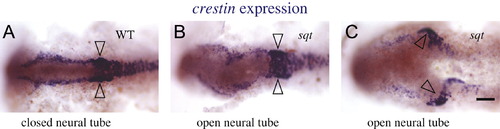
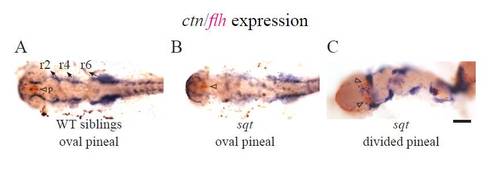
The neural crest gene crestin is expressed in embryos with an open neural tube. sqt embryos with an open neural tube were identified by two-color WISH by first detecting flh in the pineal with a red precipitate (not shown as it is out of the focal plane of the image). The crestin signal in the neural crest cells was then detected via a purple precipitate. (A) In WT embryos, crestin is expressed in a large region next to rhombomeres 4–6 (open arrowheads), and in two stripes of cells on the left right sides at the borders of the folding neuroepithelium. ((B) and (C)) In sqt embryos with an open neural tube, both regions of crestin are present, although they are further apart. The experiment was repeated three times and representative images are shown. Embryos were fixed at the 8–10 somite stage. All images are dorsal views with anterior to the left. Scale bar=50 μm. EXPRESSION / LABELING:
|
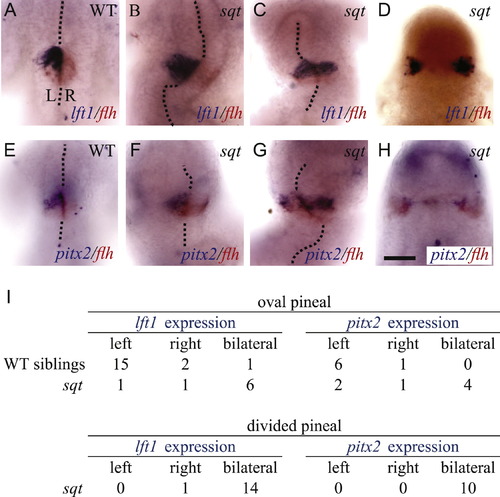
Left-sided gene expression in the developing pineal is disrupted when the neural tube does not close. (A) Left sided expression of lft1 and bilateral expression of flh in the left pineal anlage of a WT embryo. (B) WT expression pattern of lft1 and flh in a sqt mutant with a closed neural tube. (C) Bilateral lft1 and flh expression in a sqt mutant with a closed neural tube. (D) Expression of lft1 and flh in both the left and right sides of a sqt embryo with a divided pineal anlage. (E) WT embryo with pitx2 on the left and flh on both sides of the developing pineal. (F) sqt mutant with a WT pattern of pitx2 expression. (G) Bilateral pitx2 expression when the pineal anlage is elongated but not fully divided. (H) sqt mutant with bilateral pitx2 expression and a divided pineal anlage. (I) Quantification of lft1 and pitx2 expression patterns in embryos with closed and open neural tubes. Embryos that did not show lft1 or pitx2 gene expression because they were too young or too old are not included in the analysis. The midline of the brain is marked with dotted lines. All embryos were fixed at 26-somites stage and are shown in dorsal views with anterior to the top. The experiment was repeated three times and representative images are shown. Scale bar=50 μm. EXPRESSION / LABELING:
PHENOTYPE:
|
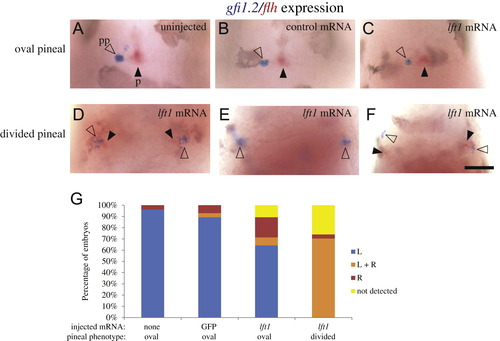
Both the left and right sides of the brain form a parapineal when the epithalamus is divided. foxd3:GFP homozygous embryos were injected with GFP mRNA or lft1 mRNA at the one to two cell stage. Injected embryos and their uninjected siblings were sorted by the pineal phenotype using fluorescent microscopy, fixed at 3 dpf, and then assayed for gfi1.2 in the parapineal (pp, closed arrowheads) and flh in the pineal (p, open arrowheads). ((A)–(C)) In uninjected embryos, embryos injected with control GFP mRNA, and in lft1 mRNA injected embryos with oval shaped pineals, the parapineal organ is located adjacent to left side of the pineal. ((D)–(F)) In the lft1 mRNA injected embryos with divided pineal organs (not shown, as pineal is out of the focal plane of the image), there is a region of gfi1.2 expression on both the left and right sides of the brain, suggesting two parapineal organs have formed. (G) Graph of data represented in ((A)–(F)). The experiment was repeated four times and representative images are shown. ne26 for each pineal phenotype. Dorsal views, anterior to the top. Scale bar=50 μm. EXPRESSION / LABELING:
|

n-cadherin (cdh2vu125) mutants exhibit left-right asymmetry defects. ((A)–(C)) Confocal images of the immunofluorescence labeling of foxd3:GFP positive embryos at 2 dpf. foxd3:GFP is expressed in the pineal and parapineal (white arrowheads) organs. Axonal projections from parapineal neurons are denoted with open arrowheads. ((D)–(F)) Two-color in situ hybridization showing parapineal cells expressing gfi1.2 (blue) and pineal cells expressing flh (red) in 2 dpf embryos. The dashed lines represent the embryonic midline. ((A) and (D)) WT embryos have a fused, oval pineal organ and a single left sided parapineal organ. ((B) and (E)) Approximately half of the cdh2 mutants with a divided pineal organ have only a single parapineal organ. ((C) and (F)) Approximately half of the cdh2 mutants with a divided pineal organ have two bilaterally located parapineal organs. All images are dorsal views with representative images shown. All scale bars=20 μm. (G) Graph of parapineal placement in WT siblings (n=261), cdh2 mutants with oval shaped pineal (n=46) and cdh2 mutants with divided pineal (n=114). |
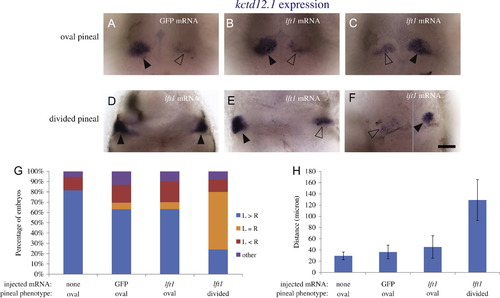
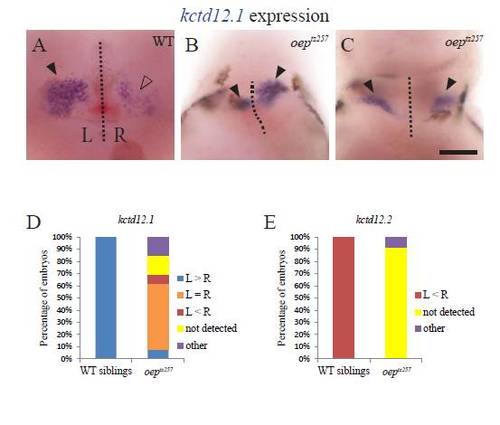
kctd12.1 expression in the habenulae becomes bilateral when the neural tube does not close. foxd3:GFP embryos injected with GFP mRNA or lft1 mRNA and uninjected siblings were sorted by the pineal phenotype, fixed at 3 dpf, and then assayed for expression of kctd12.1 in the habenula nuclei. ((A)–(C)). When the pineal is oval shaped, kctd12.1 expression pattern is higher on the left than on the right. ((D)–(F)) When the pineal is divided, the habenula can either have (D) high levels of kctd12.1 in both the left and right sides, (E) higher expression on the left, or (F) higher expression on the right. The image in F is a composite, as the two habenula were in different focal planes. Closed arrowheads indicate the habenulae with higher level of kctd12.1 expression, open arrowheads the habenulae with lower kctd12.1 expression. (G) Distribution of the kctd12.1 expression patterns in each group of embryos. The embryos categorized as “other” (<6%) had either a single kctd12.1 expression domain near the midline or many small areas of kctd12.1 expression. ne25 for each group. (H): The distance between the two habenulae measured at the points where they were closest to each other. n≥13 for each group. Avg±standard deviation. p<0.001 by single-factor ANOVA. A Tukey–Kramer test finds significant differences between the divided pineal group and all other groups beyond a 99% confidence level. The experiment was repeated two times and representative images are shown. All images are dorsal views, anterior to the top. Scale bar=50 μm. |

kctd12.2 expression is low in both habenulae when the epthalamus is divided. Embryos were processed as in Fig. 8 but assayed instead for kctd12.2 expression. ((A)–(C)) kctd12.2 expression is higher on the right in embryos with an oval shaped pineal. (D) kctd12.2 is expressed at undetectable levels in the majority of embryos with divided pineal organs. The low or undetectable levels of kctd12.2 expression were not due to technical difficulties, as WT embryos processed in parallel had normal levels of expression. Closed arrowheads indicate the habenulae with higher level of kctd12.2 expression. Open arrowheads indicate the habenulae with lower expression. (E) The distribution of kctd12.2 expression pattern in each group of embryos. “Other” includes embryos with either a single kctd12.2 expression domain or many small areas of kctd12.2 expression. ne17 for each group. The experiment was repeated three times and representative images are shown. All images are dorsal views, anterior to the top. Scale bar=50 μm. |
|
|
|

|
|
Reprinted from Developmental Biology, 374(2), Lu, P.N., Lund, C., Khuansuwan, S., Schumann, A., Harney-Tolo, M., Gamse, J.T., and Liang, J.O., Failure in closure of the anterior neural tube causes left isomerization of the zebrafish epithalamus, 333-344, Copyright (2013) with permission from Elsevier. Full text @ Dev. Biol.