
- Title
-
Single-cell-resolution imaging of the impact of notch signaling and mitosis on segmentation clock dynamics
- Authors
- Delaune, E.A., François, P., Shih, N.P., and Amacher, S.L.
- Source
- Full text @ Dev. Cell
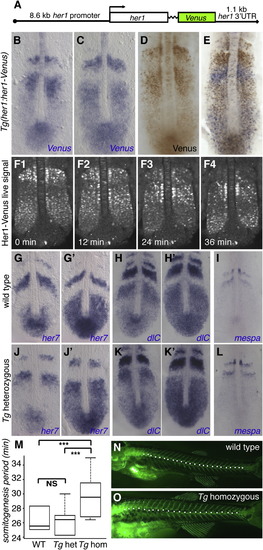
The Zebrafish Transgenic her1:her1-Venus Line Recapitulates Dynamic her1 Expression(A) Diagram of the her1:her1-Venus construct.(B=E) Cyclic reporter transcript and protein expression in heterozygous Tg(her1:her1-Venus) embryos. Transcript (blue) and protein (brown) are largely expressed out of phase.(F) Still images from Movie S1 (in dorsal view) reveal waves of dynamic reporter expression in the PSM.(G-L) her7 (G, G′, J, and J′), dlc (H, H′, K, and K′), and mespa (I and L) expression in wild-type (G-I) and heterozygous Tg(her1:her1-Venus) (J-L) embryos.(M) Segmentation speed in wild-type (n = 20), her1:her1-Venus heterozygous (n = 26) and homozygous (n = 29) embryos. Somites were first counted at the two- to six-somite stage, and then again after 4-5.5 hr of development at 28°C. The box represents segmentation speed values between the first and third quartiles, the bold line represents the median value, and the whiskers represent maximal and minimal values. Homozygous transgenic embryos segmented significantly more slowly than heterozygote and wild-type embryos. A Wilcoxon rank sum test yielded significant differences for wild-type versus homozygote (p < 10-5), and heterozygote versus homozygote (p < 10-5), but not wild-type versus heterozygote (p = 0.87) embryos.(N and O) Segment number and size in wild-type (H) or homozygous her1:her1-Venus (I) larvae. Calcified skeletal structures were revealed at 21 dpf by calcein staining (Du et al., 2001). The total number of precaudal, transitional, and caudal segments (white dots; Bird and Mabee, 2003) was significantly lower in homozygous transgenic larvae (median = 21 segments, n = 64) than in wild-type larvae (median = 24, n = 33; Wilcoxon rank sum test, p < 10-5). Note that the segment size appears larger in homozygous her1:her1-Venus compared with wild-type larvae.See also Figures S1 and S2 and Movie S1. |

Detection and Analysis of Clock Oscillations at Single-Cell Resolution(A and B) Confocal section of the PSM of a 12-somite-stage heterozygous her1:her1-venus embryo (lateral view, anterior left) injected with membrane-mCherry and H2B-Cerulean mRNAs at the one-cell stage. Raw signals for membrane-Cherry (red) and H2B-Cerulean (blue) are shown in (A), and for Her1-Venus (green) in (B).(C) Image resulting from automated 3D segmentation of confocal pictures and cell tracking using our MATLAB-based program. Green cell contours are automatically generated and can be manually deleted or added. White and yellow numbers indicate tracking information, which is also automatically generated and can be manually corrected and validated.(D) Raw fluorescence data from a single PSM cell showing four oscillations over time.(E and F) Illustration of the heuristic algorithm used to compute the oscillation phase. First the signal is smoothed, then the average value over a predefined time window comparable to the period is removed (E), and finally the amplitude of the signal is rescaled over the same time window to obtain a pseudo sine wave (F, blue line). Phase (F, red line) is computed as detailed in the Experimental Procedures.See also Figure S3. |

Notch Signaling Is Required for Synchronous Oscillation in Neighboring PSM Cells(A-D) Reporter expression in six to seven neighbor cells tracked through time in wild-type (A′ and A′′), bea (B), aei (C), and des (D) embryos heterozygous for the Tg(her1:her1-Venus) transgene. Dashed gray lines in A2 and A3 indicate the time of somite boundary formation. The schematic drawing in (A) represents a lateral view of the PSM in a wild-type embryo (anterior to the right), showing newly formed (S1 and S2) and presumptive (S-2, S-1, and S0) somites.(E-I) Pseudo-coloration of cells based on the oscillation phase (E) at a single time point in wild-type (F), bea (G), aei (H), or des (I) mutant embryos.(J-M) Histograms of phase shift between all tracked neighbor cells at all time points for wild-type (J), bea (K), aei (L), and des (M) mutant embryos. Phase-shift distributions for three separate embryos (black, gray, and beige bars) are shown. A two-sample t test of wild-type embryos with each mutant indicates significant differences (two-tailed t test, ± = 0.05): WT versus aei (t = 40.02, p < 105), WT versus bea (t = 55.68, p < 105), and WT versus des (t = 53.13, p < 105).See also Figure S4 and Movies S2 and S3. |
Reprinted from Developmental Cell, 23(5), Delaune, E.A., François, P., Shih, N.P., and Amacher, S.L., Single-cell-resolution imaging of the impact of notch signaling and mitosis on segmentation clock dynamics, 995-1005, Copyright (2012) with permission from Elsevier. Full text @ Dev. Cell