
- Title
-
Morphogenesis and Cell Fate Determination within the Adaxial Cell Equivalence Group of the Zebrafish Myotome
- Authors
- Nguyen-Chi, M.E., Bryson-Richardson, R., Sonntag, C., Hall, T.E., Gibson, A., Sztal, T., Chua, W., Schilling, T.F., and Currie, P.D.
- Source
- Full text @ PLoS Genet.

Distinct muscle precursor populations within the adaxial compartment. (A-C) The adaxial cell compartment. (A) Cross-section and (B) single confocal scan, dorsal view of a newly formed somite where the adaxial cells express the sMyHC (red). Nuclei and membranes are also marked with DAPI (blue) and membrane-bound GFP (green). (C–M) Restrospective fate map of the adaxial cell compartment. Adaxial cell behaviors occurring during the first phase of differentiation were analyzed in time lapse using a membrane-bound GFP (green) and a nuclear localized mCherry (red). The anterior-most adaxial cells in the dorso-ventral midline (yellow dot) are the first to differentiate and elongate. Adaxial cells above and below remain undifferentiated. The positions of individual confocal planes on the dorso-ventral axis are represented in (C). (N-Q) eng2a expression initiates in anterior adaxial cells at the dorso ventral midline of the myotome. 10-somite stage embryos on which in situ hybridization (ISH) for eng2a was performed alone (Blue, N, P) or in combination with myoD (Red, O,) that marks the posterior somitic region and the adaxial cells. Arrows indicate eng2a expression in the anterior adaxial cells. (Q) In situ hybridisation for smyhc demonstrates the location of the adaxial cells. (N, O) dorsal view, anterior toward the left, (P, Q) cross sections. Scale bar 50 μM. EXPRESSION / LABELING:
|
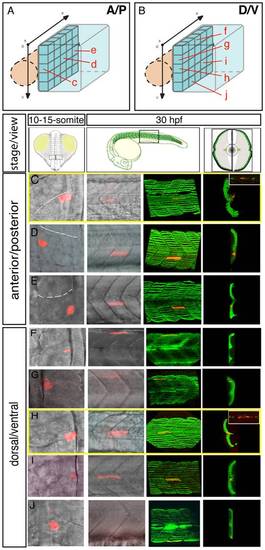
The fate map of the adaxial compartment. The fate of individual adaxial cells were identified using iontophoretic injections of TMRD (red) into individual adaxial cells located at various AP (C-E) and DV (F-J) positions within the three most newly formed somites of 10-15-somite stage embryos (C-J, left panels, dorsal views). The AP (A) and DV (B) position of labeled cells is represented schematically. The fate of cells was then analyzed at 30 hpf (C-J, other panels). (C-J) At 30 hpf, the panels (from the left to the right) represent the position of the labeled fiber in the myotome (lateral view), the expression of sMyHC (green, 3D reconstruction of multiple confocal scans) in lateral view and in cross section, and the expression of Engrailed (green, small upper panels for C and H, lateral view). MPs (C, H) were identified due to their position in the midline and simultaneous expression of Slow MyHC and Eng. |

FGF signaling is down regulated in muscle pioneer precursor domain. (A-B) Asymmetric expression of erm at 9-somites as determined by ISH on (B-B′′) serial sagittal sections and (A) cross-section. Panel (B′*) represents a high magnification of the region in box in (B′) panel. The different positions of sagittal sections are represented in (A). Expression of erm is absent in anterior adaxial cells (arrow heads). (C) spry4 expression in a 9-somite embryo determined by ISH on a cross section of the anterior somitic region. (D-D′′′) Expression of spry4 mRNA (D′, red), sMyHC (D′′, green) and DAPI (D-D′′, blue) in 9-somite embryos, dorsal view. spry4 expression in the anterior adaxial cells is indicated (arrow heads). D′-D′′′ high magnification view of the area boxed in D. EXPRESSION / LABELING:
|

sprouty4-mediated FGF inhibition promotes muscle pioneer formation. Erm (A), pea3 (B) and spry4 (C) expressions in 10–13-somite embryos after DMSO or SU5402 treatments as determined by in situ hybridization. (D) sMyHC (green) and (E) Eng (black) expression in transverse sections of 1 dpf embryos, after treatment with DMSO or SU5402 applied at the 6-somite stage. (F) eng2a expression at 10-somite after treatment with DMSO or SU5402, as determined by ISH (Dorsal view, anterior towards the left). (G-J) Expression of a dominant negative form of fgfr1 fused with GFP (green) (G) is induced after heat shock in hsp70l:dnfgfr1-GFP embryos at 13–15-somite stage. (H) Expression of the target gene of FGF signaling cascade, diphosphorylated ERK (dpERK, red), which is down regulated in 13–15 somite embryos after heat shock compared to no heat shocked control. By contrast (I) eng2a is up-regulated at 1 dph after heat shock as revealed by ISH and (J) slow fibre migration is impaired, as revealed by 3D reconstructed sMyHC expression (lateral view and cross section). (K) Graphic representation of the number of MPs per somite in 1 dpf embryos after treatment with DMSO or SU5402 applied at the 10-somite stage. The horizontal axis represents the position of the somite along the body axis, 1 being the most rostral somite, values = means, error bars = standard error of the mean (s.e.m.). (L-Q) Ectopic expression of spry4, dn-spry4 or dn-BMPr in slow precursors was obtained after injection of (L, N, O, O′, O′′) smyhc:spry4-ires-GFP, (L, P) smyhc:dn-spry4-ires-GFP and (L, Q) smyhc:dn-BMPr-GFP DNA constructs into one cell embryo, respectively. (L, M) smyhc:GFP construct was used as the injection control. (L) Graphic representation of the different fates of transgenic slow fiber (SSF, MP and SSF en+) upon ectopic expression of GFP, spry4, dnspry4 or dnBMPr. Values = means of percentages of transgenic muscle fibers per injected embryo (nembryo = 6–9 per condition). We performed analysis of variance (ANOVA) to determine statistical difference within a 95% confidence interval: ** p<0.005, ***p<0.001. (M–Q) Images reveal the expression of GFP (green) and Eng (red) in the somites of 1 dpf embryos by maximum projections of multiple confocal scans (M, N, P, Q) or single confocal scan (O–O′′). SSFs (arrow heads) and MPs (*) are indicated. (O–O′′) In 4.19% of cases, the spry4 transgene triggers expression of Engrailed in post-migratory slow fibers (arrows, p<0.05). (O′, O′′) high magnification of the region boxed in O. Scale bar = 25 μm. EXPRESSION / LABELING:
PHENOTYPE:
|

sprouty4 loss-of-function leads to the reduction of MP formation. (A) Sequencing of spry4WT and spry4fh117 confirms the single A to T mutation in position 469 of the spry4 ORF, resulting in the premature stop codon. (B) Predicted peptide arising from spry4WT and spry4fh117. The mutation results in a truncated protein of 157 amino acids (K157 in red is replaced by a stop codon) lacking the conserved cysteine rich domain [31] also called the spry domain (blue). This domain has been involved in RTK inhibition in other systems. (C–F) spry4 expression at 10-somite in WT, spry4fh117/+, Z spry4fh117 and MZ spry4fh117 embryos as determined by in situ hybridization. Whole mounted embryos, lateral view. (G–H) Erm expression in 9-somite WT and MZ spry4fh117 embryos. Flat mounted embryos, anterior toward the top. (I–J) sMyhc expression (red) in the somites of (I) WT and (J) MZ spry4fh117 embryos at 1 dpf. Maximal projection of multiple confocal scans, lateral view. (K) Graphic representation of the number of MPs per somite of 1 dpf embryos in different conditions: WT, spry4fh117/+, and MZ spry4fh117 untreated embryos or after DMSO or SU5402 treatments, values = means, error bars = s.e.m, ***p<0.001. (L–O) Engrailed (green) and Prox1 (red) expression in the somites of 1 dpf WT or MZ spry4fh117 embryos, after DMSO or SU5402 treatments, scale bar = 50 μm. EXPRESSION / LABELING:
PHENOTYPE:
|
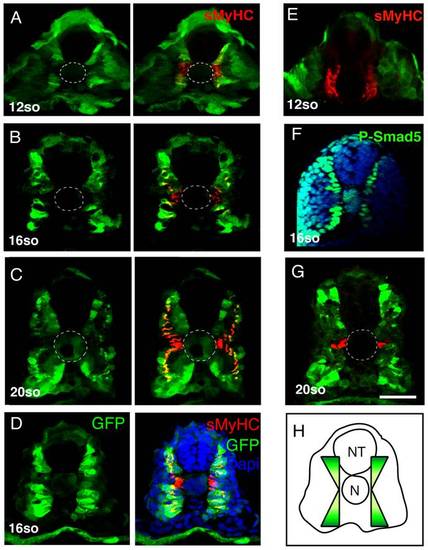
BMP signaling forms a dorsal and ventral gradient within the myotome. (A, B, C, D, E) Expression of GFP (green) and sMyHC (red) at indicated stages in Tg(5XBre[vent2]:-201id3:gfp) embryos uninjected or (E) after radar morpholino (rdrMO) injection. (F) Expression of phosphorylated-Smad5 (green) and nuclei (DAPI, blue) in 15-somite WT embryos. (G) Engrailed (red) and GFP (green) expression in Tg(5XBre[vent2]:-201id3:gfp) embryos at 20-somites. Cross-sections, maximum projections of multiple confocal scans. Scale bar 50 μm. EXPRESSION / LABELING:
|

Radar or BMP signaling knock-down impairs MP formation. (A) The level of expression of spliced radar and β-actin mRNAs was analysed by semi-quantitative RT-PCR. Total RNA extracts were prepared at 1 dpf from uninjected embryos and from embryos that were injected with morpholinos blocking the splicing of radar (rdrMO). The number of cycles is shown. (B) Graphic representation of the number of MPs per somite at 1 dpf in the indicated conditions, values = mean, error bars = s.e.m., ***p<0.001. (C–D) eng2a expression at the 12-somite stage in (C) uninjected, or (D) rdrMO-injected embryos, as determined by ISH. (E–J) MPs staining with anti-Eng (green) and anti-Prox1 (red) antibodies at 1 dpf embryos in (E) uninjected, (F) rdrMO-injected embryos, (G) p53MO- and rdrMO-injected embryos, (H) radar mutant (rdrs327), (I) Dorsomorphin (DM) treated embryos and (J) SU5402-treated embryos that were injected with rdrMO, scale bar = 20 μm. (K–M) sMyhc (red) expression in the somites of (K) WT, (L) radar morphans and (M) P53/radar double morphans (rdrMO/P53MO) at 1 dpf, 3D reconstructions of multiple confocal scans, lateral and cross section views, scale bar = 20 μm. (N–Q) Eng2a expression in the somites of 1 dpf embryos after treatment with increasing doses of Dorsomorphin (10, 20 and 50 μM) or with DMSO (1%), scale bar 100 μm. (R–S) GFP expression in Tg(5XBRE[vent2]:-20lid3:GFP) embryos at 60 hpf after (S) DM (50 μM) or (R) DMSO (1%) treatments, showing that DM treatment inhibits BMP signaling. (T–W) Eng2a expression in 1 dpf embryos that were (U–W) injected or (T–V) not with rdrMO and treated with either (T–U) DMSO or (V–W) SU5402. EXPRESSION / LABELING:
PHENOTYPE:
|

FGF and BMP signaling coordinates the fate of adaxial cells. (A) Individual adaxial cells located in the posterior region of the adaxial cells at various D/V positions were labeled according to the diagram. (B–C–D) The fate of the adaxial cells after treatment of SU5402 alone or (E) in combination with Dorsomorphin (DM) was followed using iontophoretic injections of TMRD (red) within the newly formed somites of 10- to 15-somite embryos (left panels, dorsal views). Their fate was analyzed using anti-Engrailed antibody staining (green) at 30 hpf (right panels, lateral views). |

FGF inhibition does not alter the number of medial fast fibers. (A) Prox1 (red) and Engrailed (green) expression in the somites of 1 dpf WT embryos after DMSO or SU5402 treatments. SU5402-mediated FGF inhibition does not change the number of medial fast fibers (MFF), here revealed by a low expression of engrailed but not Prox1 expression (*). (B) Graphic representation of the number of MFF per somite of 1 dpf WT embryos after DMSO and SU5402 treatments, values = means, error bars = standard error of the mean (s.e.m.). The difference between the two conditions is not significant (NS, p value = 0.34). |

Hedgehog and primary cilia are not affected by FGF signaling inhibition. (A) ptc1 expression is similar in DMSO and in SU5402 treated embryos at 13-somite, as determined by in situ hybridization. Flat mounted embryos, dorsal view, anterior towards the top. (B) Acetylated-tubulin and γ-tubulin expression in 13-somite embryos after DMSO or SU5402 treatment. Number and length of primary cilia of the adaxial cells in the presomitic mesoderm (arrow heads) are unaffected by SU5402 treatment. Pictures are single confocal scans, dorsal view. Dashed line shows the limit between the notochord (nc) and the presomitic mesoderm. Adaxial cells are adjacent to the notochord. Scale bars: 10 μm. |

Radar/gdf6a morpholinos-induced phenotype is reversed by WT rdr mRNA injection. (A-E) Live embryos at 1 dpf either (A) uninjected or (B) injected with rdr morpholinos (rdrMO) showing reduced eyes, massive cell death in the anterior neural tube and flatten somites (arrow heads, C1 phenotype). (C-D) Injections of 10–100 pg of rdr mRNA either alone (not shown) or in combination with rdrMO induce severe gastrulation defects as described in Sidi et al, 2003 (C2 and C3 phenotype). (E) Only a low quantity of rdr mRNA (0.5–1 pg) rescue the phenotype induced by rdrMO injection (C4 phenotype or WT). (F) Graphic representation of the percentage of embryos exhibiting WT, C1-C4 or dead phenotype in indicated conditions. (G-I) Prox1 (red) and Engrailed (green) expression in the somites of 1 dpf embryos either (G) uninjected or injected with (H) rdrMO alone or (I) in combination with 1 pg of rdr mRNA. Increased MP number observed in rdrMO injected embryos is reversed by WT rdr mRNA, showing that altered MP number is specifically induced by rdr loss-of-function. |
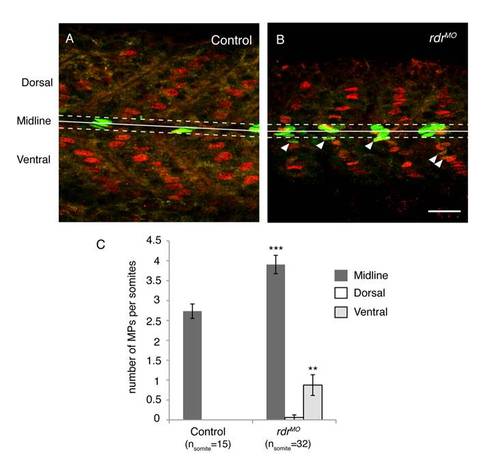
Supernumerary MPs in rdr morphans are mainly localised in the midline and in the ventral region of the myotome. MPs were stained with anti-Eng (green) and prox1 (red) antibodies in uninjected controls (A) and rdr MO injected (B) embryos at 1 dpf. The midline (solid line), midline region (dashed lines), ventral and dorsal regions are shown. Here the midline region corresponds to the 5 µm regions flanking either side of the midline. Scale bar = 25 μm (C) Graphic representation of the number of MPs in the midline, dorsal and ventral regions of the somite in uninjected controls and rdr morphans. ***p<0.001 and **p<0.005, values = means and error bars = S.E.M. |