
- Title
-
Identification and functional characterization of cardiac pacemaker cells in zebrafish
- Authors
- Tessadori, F., van Weerd, J.H., Burkhard, S.B., Verkerk, A.O., de Pater, E., Boukens, B.J., Vink, A., Christoffels, V.M., and Bakkers, J.
- Source
- Full text @ PLoS One
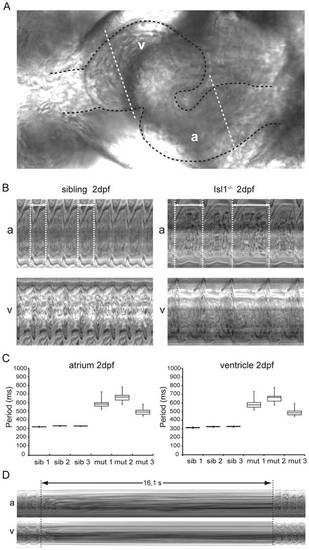
Characterization of the embryonic Isl1-/- cardiac phenotype in vivo. (A) Zebrafish embryonic heart at 2 dpf. The embryonic heart is highlighted in black dotted contour; white dotted lines through the atrium (A) and the ventricle (V) are placed at kymograph positions. (B) Atrial (A) and ventricular (V) kymographs from 2 dpf embryonic hearts spanning approximately 2.8 s. Note the much longer period of the Isl-/- heart when compared to the sibling and the irregularity of the period (double arrow and white dotted vertical lines). Movies are available as Movies S1 and S2, respectively. (C) Box-whisker plots representation of 20 successive heartbeats of 2 dpf Isl1-/- and sibling embryos. (D) Kymograph recorded at 3 dpf covering a period of about 16 s of absent heart contractions. For all panels a: atrium; v: ventricle. PHENOTYPE:
|
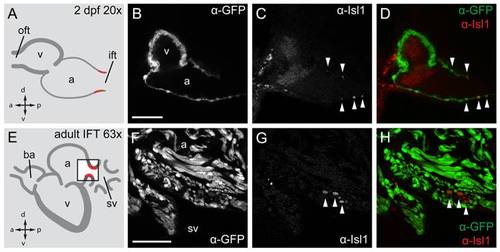
Isl1 expression in the embryonic and adult zebrafish heart. Single confocal scans of a fluorescent antibody labeling of Isl1 and eGFP in embryonic (2 dpf) (A–D) and adult (E–H) zebrafish expressing Tg(myl7:eGFP) in all cardiomyocytes. GFP+ cardiomyocytes are displayed in grey (B, F) and in green in (D, H). Isl1 is shown in grey (C, G) and in red (D, H). Arrowheads indicate Isl+/GFP+ cells. Illustrations of a lateral view of a 2 dpf (A) and adult (E) zebrafish heart indicate the location of Isl1+ cells (red). The box in panel E represents the area shown in (F–H). (B–D) Fluorescent immunolabeling of Isl1 and eGFP in a 2 dpf embryo (sagittal section 100 μm). At this time point Isl1+/GFP+ cells were only found in the IFT of the heart. (F–H) Fluorescent immunolabeling of Isl1 and eGFP in an adult zebrafish heart (sagittal section 100 μm). Isl1+/GFP+ cells are located at the junction of the sinus venosus and atrium in the inflow region of the heart (arrowheads). Isl1+ cells showed low expression of myl7. v, ventricle; a, atrium; oft, outflow tract; ift, inflow tract; ba, bulbus arteriosus; sv, sinus venosus; a, anterior; p, posterior; d, dorsal; v, ventral. Scale bars represent 50 μm. |

Molecular characterization of the adult isl1 expression domain. (A–E,G,H) Section in-situ hybridizations on adult wild-type zebrafish hearts. Probes are indicated in the panels. (A) 4-chamber view of a sagittal section through zebrafish heart labeled with the myocardial marker myl7. The box indicates the region shown enlarged in panels B–E,G,H. Demarcated areas (C) indicate isl1 expression in the tbx2b+ hcn4+ nppa- myocardium at the base of the valves surrounding the sinoatrial junction. BMP4 signal is pointed at in the valves by arrowheads in (H). (F) 3D reconstruction of the sinoatrial junction. isl1 (yellow) is expressed around the entire sinoatrial junction, forming a ring-like structure. (I–L) Reconstruction of a confocal scan through a sagittal section of the inflow region of adult Tg(isl1BAC:GalFF; UAS:GFP) transgenic zebrafish heart. Fluorescent antibody labeling for GFP (shown in grey (I, I′, L) or green (K, K′)) and for Isl1 (shown in grey (J, J′) or red (K, K′)). GFP+/Isl1+ cells were found in bilateral populations at the sinoatrial junction (arrows). (I′–K′) Enlargement of the GFP+/Isl1+ cells at the dorsal rim of the inflow tract (indicated with dashed box in (I)). Nuclei of GFP+ cells were positive for Isl1 (arrowheads). (L) Enlargement of GFP+ cells (transverse section) shows a string of contiguous cells. a, atrium; avc, atrioventricular canal; ba, bulbus arteriosus; sv, sinus venosus; v, ventricle; l, left; r, right; a, anterior; p, posterior; d, dorsal; v, ventral. Scale bars represent 50 μm (A–G, I–K) or 10 μm (I′–K′,L). EXPRESSION / LABELING:
|

Isl1 cells have pacemaker activity. (A–C) Optical mapping on an explanted, contracting adult zebrafish tg(isl1BAC:GalFF; UAS:GFP) heart. Arrow indicates the sinus venosus in all panels. (A) Explanted adult zebrafish heart. (B) GFP-fluorescent cells reporting Isl1 expression are situated at the sinus venosus. (C) The activation pattern measured by di-4-ANEPPS fluorescence shows that the GFP+ myocytes are situated in the area of earliest activation. (D) Typical action potentials of freshly isolated GFP+ and GFP- myocytes. The GFP- cell was stimulated at 3 Hz. The inset displays a representative example of a GFP+ myocyte. EXPRESSION / LABELING:
|

Expression of tbx2b at the venous pole in embryonic heart. Expression patterns by mRNA in situ hybridization of tbx2b and nppa in 2 dpf embryos. Expression of tbx2b at the venous pole (blue staining indicated with arrowheads) does not overlap with nppa expression (red staining), which is confined to atrium and ventricle chamber myocardium. Pictures shown are ventral views with anterior to the top. EXPRESSION / LABELING:
|

Isl1 expression in the sinus node of the adult mouse heart. (A) 4-chamber view of section through adult wild-type mouse heart. Boxed region indicates the region shown enlarged in (B). (B) Expression of Isl1, depicted in red, colocalizes with the expression of the sinus node marker Hcn4, depicted in green. Dotted line in (B) demarcates the sinus node. ao, aorta; la, left atrium; lv, left ventricle; ra, right atrium; rv, right ventricle; scv, superior caval vein. |

Immunohistochemical detection of Islet-1 in human cardiomyocytes in the sinoatrial node. (A) Hematoxylin and eosin staining of the sinoatrial node. SN indicates the area of the node showing where the specialized cardiomyocytes are located. MC indicates myocardium adjacent to the node. NA indicates the nodal artery. The boundary between SN and MC is highlighted by the dotted line. Scale bar represents 400 μm. (B) Elastic van Giesen stain of a consecutive section of (A) illustrating that the cardiomyocytes are embedded within collagen and elastic tissue. Scale bar represents 400 μm. (C) Islet-1 immunostain of sinoatrial node. SN indicates sinoatrial node. MC indicates myocardium adjacent to the node. The boundary between SN and MC is highlighted by the dotted line. Scale bar represents 160 μm. (D) Magnification of the boxed region in (C). Islet-1 immunostain with positive brown staining of the nuclei of the cardiomyocytes. On average 5% of the cardiomyocytes in the sinoatrial node revealed a positive signal. Scale bar represents 40 μm. (E) Staining is absent in the myocardium next to the sinoatrial node. Scale bar represents 80 μm. |
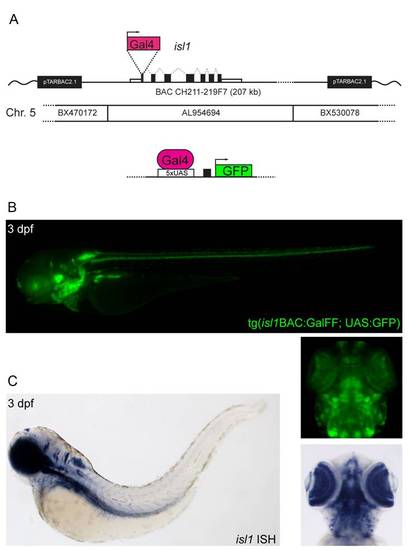
Generation of a reporter transgenic line for isl1. (A) An expression cassette containing the GalFF gene >[42] and kanamycin resistance gene was inserted by recombineering into BAC CH211-219F7 at the ATG site of the 1st exon of the isl1 gene. The site of recombineering is approximately 40 kb inside the BAC sequence, minimizing any risk of loss of isl1 regulatory sequences. The recombined BAC was then injected in a tg(UAS:GFP) background [1] to obtain the fluorescent Isl1 expression reporter line Tg(Isl1BAC:GalFF; UAS:GFP). (B) GFP expression pattern of the Tg(Isl1BAC:GalFF; UAS:GFP) line at 3 dpf. (C) Isl1 ISH on WT embryo at 3 dpf. The expression pattern of GFP, reporting for isl1 expression, in the Tg(isl1BAC:GalFF; UAS:GFP) is validated by comparison with the isl1 ISH. Especially visible are the identical expression pattern in the eyes and hindbrain. |

Isl1BAC reporter activity in adult heart. Confocal images of Tg(isl1BAC:GalFF; UAS:RFP; myl7:eGFP) after immunolabeling with anti-RFP and anti-GFP antibodies (A), or Tg(isl1BAC:GalFF; UAS:GFP) after immunolabeling with anti-GFP and antitropomyosin antibodies (B). Isl1 expressing cells (indicated with arrows) are located at the base of the venous valves and contain much lower levels of myosin light chain or tropomyosin compared to surrounding myocardial cells. Axonal Isl1/GFP+structures are visible at the outer surface of the myocardium. Scale bars represent 50 μm |