
- Title
-
An in vivo method to quantify lymphangiogenesis in zebrafish
- Authors
- Hoffman, S.J., Psaltis, P.J., Clark, K.J., Spoon, D.B., Chue, C.D., Ekker, S.C, and Simari, R.D.
- Source
- Full text @ PLoS One

Lymphangiography reveals lymphatic capillaries in early zebrafish development. A, Subcutaneous injection technique employed for lymphangiography. The narrow red triangle represents the needle used to inject Texas Red-LMD into the zebrafish posterior tail. The black box demarcates the approximate region of the trunk imaged. B and C, Ideal lymphangiogram of 3-dpf Tg(fli1:EGFP)y1 zebrafish (green blood vessels). B, At 15 minutes post-injection (early-phase), green ISVs (large white arrows) are distinguished from extravascular collections of Texas Red-LMD at somitic boundaries (yellow arrowheads) and small red lymphatic vessels (small white arrows) deep to and within the somitic interspaces. C, At 4 hours post-injection (late-phase), Texas Red-LMD is still not present within ISVs (large white arrows); however, more of the small lymphatics contain Texas Red-LMD and comprise an intricate array of capillaries (small white arrows). D and E, Typical lymphangiogram at 15 minutes and 4 hours post-injection, in which images are partially-obscured by blotches of Texas Red-LMD (green arrows) that diffused from the original subcutaneous site. Scale bars, 50 μm. |

Late-phase microangiography clearly demonstrates lymphatic capillaries in early zebrafish development. A, Intracardiac injection technique employed for microangiography. The narrow red triangle represents the needle used to inject Texas Red-LMD into the zebrafish heart. The black box demarcates the approximate region of the trunk imaged. B and C, Microangiogram of 3-dpf Tg(fli1:EGFP)y1 zebrafish. B, At 15 minutes post-injection (early-phase), Texas Red-LMD is primarily within ISVs (large white arrows), and lymphatic capillaries contain no Texas Red-LMD. C, By 4 hours post-injection (late-phase), most Texas Red-LMD has leaked from the blood vessels and collected at somitic boundaries (yellow arrowheads) or within deep lymphatic capillaries (small white arrows). Scale bar, 50 μm. |
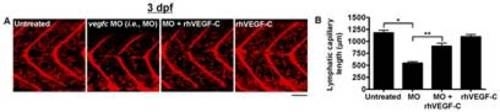
Quantification of lymphatic capillary development after knockdown with a vegfc morpholino. Red fluorescent images from late-phase microangiograms of Tg(fli1:EGFP)y1 zebrafish are shown, highlighting Texas Red-LMD uptake within lymphatic capillaries. Results of quantitative morphometric analyses are displayed in bar graphs. A and B, Zebrafish injected with a vegfc morpholino (MO) have significant inhibition of lymphatic capillary growth at 3 dpf (n = 32) compared to untreated zebrafish (n = 32) or those exposed to rhVEGF-C (n = 14), which is mitigated by the addition of rhVEGF-C (100 pg/ml) to the aqueous environment (n = 15). *P<0.0001, **P<0.0001. Scale bars, 50 μm. |

Quantification of lymphatic capillary development after knockdown with a vegfc morpholino. Red fluorescent images from late-phase microangiograms of Tg(fli1:EGFP)y1 zebrafish are shown, highlighting Texas Red-LMD uptake within lymphatic capillaries. Results of quantitative morphometric analyses are displayed in bar graphs. A and B, Zebrafish injected with a vegfc morpholino (MO) have significant inhibition of lymphatic capillary growth at 3 dpf (n = 32) compared to untreated zebrafish (n = 32) or those exposed to rhVEGF-C (n = 14), which is mitigated by the addition of rhVEGF-C (100 pg/ml) to the aqueous environment (n = 15). *P<0.0001, **P<0.0001. Scale bars, 50 μm. |

Quantification of lymphatic capillary development after stimulation with rhVEGF-C. Red fluorescent images from late-phase microangiograms of Tg(fli1:EGFP)y1 zebrafish are shown, highlighting Texas Red-LMD uptake within lymphatic capillaries. Results of quantitative morphometric analyses are displayed in bar graphs. A and B, At 2 dpf, fewer lymphatic capillaries are present in untreated zebrafish (n = 18), compared to 3-dpf untreated zebrafish (n = 32), but they increase significantly with the addition of rhVEGF-C to the zebrafish aqueous environment (n = 18). *P<0.0001, **P<0.0001. Scale bars, 50 μm. |
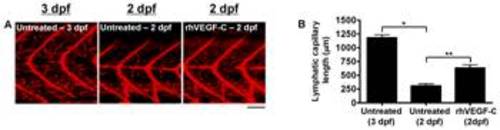
Quantification of lymphatic capillary development after stimulation with rhVEGF-C. Red fluorescent images from late-phase microangiograms of Tg(fli1:EGFP)y1 zebrafish are shown, highlighting Texas Red-LMD uptake within lymphatic capillaries. Results of quantitative morphometric analyses are displayed in bar graphs. A and B, At 2 dpf, fewer lymphatic capillaries are present in untreated zebrafish (n = 18), compared to 3-dpf untreated zebrafish (n = 32), but they increase significantly with the addition of rhVEGF-C to the zebrafish aqueous environment (n = 18). *P<0.0001, **P<0.0001. Scale bars, 50 μm. |
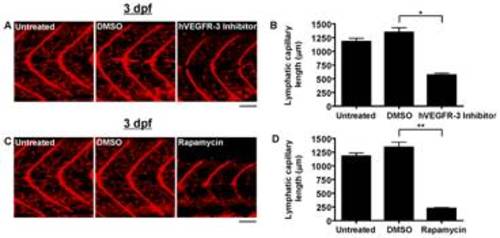
Quantification of lymphatic capillary development after inhibition with small molecules. Red fluorescent images from late-phase microangiograms of Tg(fli1:EGFP)y1 zebrafish are shown, highlighting Texas Red-LMD uptake within lymphatic capillaries. Results of quantitative morphometric analyses are displayed in bar graphs. A and B, Addition of hVEGFR-3 inhibitor in DMSO (n = 30) or rapamycin in DMSO (n = 18) to the aqueous environment significantly reduced lymphatic capillary development at 3 dpf, compared to zebrafish exposed to DMSO alone (n = 21 and 15, respectively). *P<0.0001, **P<0.0001. Scale bars, 50 μm. |

Quantification of lymphatic capillary development after xenotransplantation. Green fluorescent images (fli1:EGFP) reveal blood vessels, red fluorescent images (Texas Red-LMD) reveal lymphatic capillaries, and blue fluorescent images (CellTracker) reveal transplanted cells in 3-dpf Tg(fli1:EGFP)y1 zebrafish. Results of quantitative morphometric analyses are displayed in bar graphs. A–D, At 3 dpf (n = 32), the inhibitory effect of the vegfc morpholino MO (n = 32) was rescued by transplantation of HUVECs (n = 18) and B16 cells (n = 20), but not 293 cells (n = 25). *P = 0.0005, **P<0.0001. Scale bars, 50 μM. All cell types (blue) were detected in major blood vessels, including the dorsal aorta (white arrowheads). HUVECs and 293 cells were also seen extravascularly, bordering lymphatic capillaries (white arrows). Note: fewer ISVs (green) in images of B16- or 293-injected morphants relates to the particular focal plane imaged, since alternative focal planes revealed approximately normal numbers of ISVs in these and other similarly-treated zebrafish (data not shown). E, Immunoblot to detect human VEGF-C in cultured HUVEC, B16, and 293 cells. The active, proteolytically-processed form of VEGF-C (21 kilodaltons, kDa) was only detected at appreciable levels in HUVEC lysate. B16 and 293 cell lysates contained VEGF-C in a dimerized precursor form (80 kDa). No VEGF-C was detected in conditioned media from any of the cells (data not shown). An antibody against α-tubulin was used as a loading control. |
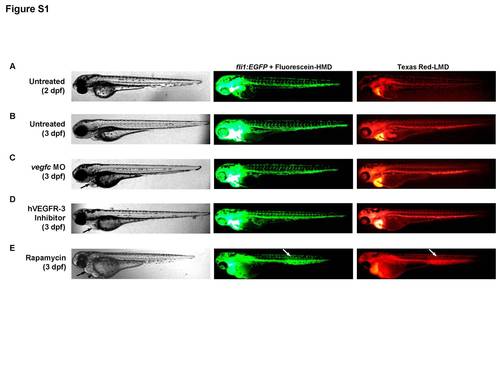
Zebrafish phenotype after vegfc morpholino injection or exposure to rapamycin or VEGFR-3 inhibitor. A–E, Representative bright field and green or red fluorescence microscopy images of whole Tg(fli1:EGFP)y1 zebrafish after microangiography with Texas Red-LMD and Fluorescein-HMD*, including untreated 2-dpf and 3-dpf zebrafish, or 3-dpf zebrafish subjected to (C) vegfc MO (5 ng), (D) hVEGFR-3 inhibitor (30 mM) or (E) rapamycin (400 ng/ml). Note, all lymphangiogenesis inhibitors (C–E) led to pericardial edema (black arrows), but it was most prominent in zebrafish exposed to rapamycin. The latter also had significant yolk sac edema (black arrowhead), and an apparent collection of fluorescently-linked dextran in the posterior trunk (white arrows), suggesting a blood vessel leak versus lymphedema. *Fluorescein-HMD was co-injected with Texas Red-LMD during microangiography to enhance the green fluorescent signal emitted by the GFP-expressing zebrafish, as well as expose significant vascular leaks. |