
- Title
-
Microbiota regulate intestinal absorption and metabolism of Fatty acids in the zebrafish
- Authors
- Semova, I., Carten, J.D., Stombaugh, J., Mackey, L.C., Knight, R., Farber, S.A., and Rawls, J.F.
- Source
- Full text @ Cell Host Microbe

Fatty Acids Accumulate in the Intestinal Epithelium in the Presence of Microbiota and Diet (A) Schematic of BODIPY-FL delivery assay in gnotobiotic zebrafish. Zebrafish derived germ free (GF) at 0 days postfertilization (dpf) were either reared GF (top) or inoculated at 3 dpf with normal microbiota (conventionalized, CONVD; bottom). From 3 to 6 dpf, fish were either starved or fed a control (C) or low-calorie (LC) diet (see Table S1). At 6 dpf, zebrafish were incubated with BODIPY-FL liposomes for 6 hr and imaged or fixed for later imaging. (B and C) Representative confocal images of the intestines of live 6 dpf GF and CONVD zebrafish incubated with BODIPY-FL C5 or C16. Scale bar, 50 μm. (B) The intestinal lumen (Lum) and epithelium (Epi; bounded by dotted lines) of GF and CONVD zebrafish are indicated. The epithelium shows apical (white arrow) and basolateral accumulation of lipid droplets (white arrowhead) labeled with BODIPY-C5. (C) Incubation with BODIPY-FL C16. (D–G) Quantification of total epithelial (D and F) and lumenal (E and G) fluorescence expressed in relative fluorescence units (RFU) in zebrafish incubated in BODIPY-FL C5 (D and E) or C16 (F and G). Values represent the means ± SEM from three independent experiments: p < 0.05; **p < 0.01. |
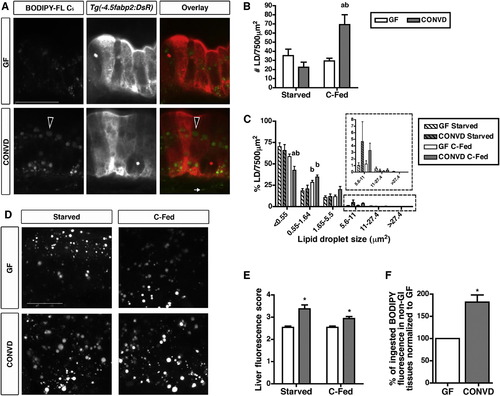
The Microbiota Stimulate Lipid Absorption into Intestinal Epithelial Lipid Droplets and Extraintestinal Tissues (A) Representative confocal images of fixed 6 dpf Tg(4.5fabp2:DsRed) GF and CONVD zebrafish fed a control diet and incubated with BODIPY-FL C5 for 6 hr. Scale bar, 20 μm. DsRed-expressing intestinal epithelial cells show BODIPY-C5 accumulation as lipid droplets (LDs) in the epithelium and the lamina propria (white arrow). Large LDs are detected in the epithelium of CONVD zebrafish (black arrowheads).(B and C) Lipid droplet quantification assay was developed using Volocity software (see Figures S1A–S1F) to determine LD number (B) and size frequency (C) in an epithelial region of interest (7,500 μm2). The graphs depict the mean ± SEM of at least two independent experiments (3–15 fish/condition/experiment). Results of statistical significance analysis: a, significant versus GF fed same diet; b, significant versus starved in same microbial condition. See Figure S2 for data from a 3 hr time point. (D) Representative confocal images of livers in 6 dpf GF and CONVD zebrafish incubated with BODIPY-FL C5 for 6 hr. Scale bar, 20 μm. (E) BODIPY-C5 fluorescence scores of livers of 6 dpf GF and CONVD zebrafish. The graph depicts the mean ± SD of two independent experiments (3–5 fish/condition/experiment) that were scored blindly (score scale 0–5). (F) Non-GI BODIPY-C5 fluorescence in GF and CONVD C-fed zebrafish. The data represent mean ± SD of two experiments (20–30 carcasses and 9–10 whole larvae/condition/experiment). Significant differences are indicated: *p < 0.05 (E and F). |
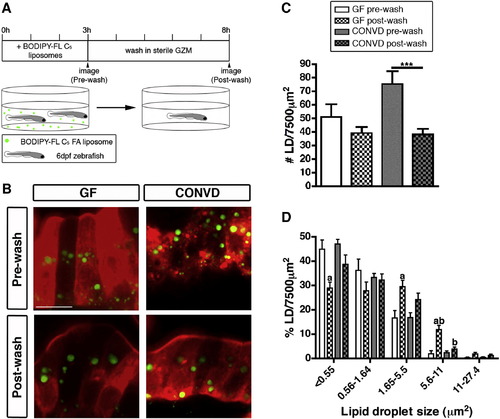
Lipid Droplet Clearance Is More Efficient in the Presence of Microbiota (A) Schematic representation of the BODIPY-FL C5 washout experiment. (B) Representative confocal images of control-fed GF and CONVD zebrafish pre- and postwash. Scale bar, 10 μm. (C and D) Quantification of lipid droplet (LD) number (C) and relative size frequency (D), shown as the mean ± SEM from two independent experiments (4–14 fish/condition/experiment), and significant differences are identified: ***p < 0.001; a, significant versus prewash in same microbial condition; b, significant versus same wash in other microbial condition. See also Figure S2. |

Monoassociations Reveal Distinct Bacterial Mechanisms for Inducing Fatty Acid Absorption in the Intestinal Epithelium (A–D) Representative confocal images of the intestinal epithelium of 6 dpf C-fed zebrafish raised GF (A) or monoassociated with Exiguobacterium sp. ZWU0009 (B), Chryseobacterium sp. ZOR0023 (C), or Pseudomonas sp. ZWU0006 (D) incubated with BODIPY-FL C5 for 6 hr. BODIPY-C5 accumulation in large epithelial lipid droplets (black arrowheads) and in the lamina propria (white arrow) is indicated. (E) Lipid droplet quantification in the intestinal epithelium of monoassociated zebrafish compared to GF controls. (F) Relative frequency of intestinal LD sizes in monoassociated zebrafish. The data represent the mean ± SEM of at least two independent experiments (5–16 fish/condition/experiment). Significant differences compared to GF controls are identified: *p < 0.05; ***p < 0.001. (G) BODIPY-C5 fluorescence scores in the livers of monoassociated zebrafish compared to GF controls. The graph represents the mean ± SEM of at least two independent experiments (2–7 fish/condition/experiment) that were scored blindly (score scale 0–5). Significant differences to GF controls are identified: *p < 0.05. (H and I) Intestinal LD number (H) and relative frequency of intestinal LD sizes (I) in GF zebrafish treated with filter-sterilized Exiguobacterium sp., Chryseobacterium sp., or Pseudomonas sp. conditioned media. Results are presented as mean ± SEM of at least two independent experiments (3–7 fish/condition/experiment) with identified significant differences compared to GF control: **p < 0.01. |

related to Figure 2. Lipid Droplet Quantification Assay Reveals Similar Lipid Droplet Formation in 6 dpf GF and CONVD Zebrafish Incubated with BODIPY-FL C5 Liposomes for 3 hr (A) Z-stack movies collected on the Olympus FV1000 laser scanning microscope were scanned using the FV1000 FLUOVIEW software. To determine single epithelial layers, we overlayed the GFP signal from the BODIPY-C5 fatty acid and the DsRed signal from the Tg(-4.5fabp2:DsRed) line, which expresses DsRed in intestinal epithelial cells. We selected three slices with independent regions of interest per fish and extracted the GFP signal only in Volocity 5.5.1. (BF) LD number and size quantification in Volocity. We imported the Z-stacks from individual fish in Volocity and opened the selected slices (B) to quantify the fluorescent signal. (C) Scale arrow, 20 μm. The red box shows the magnified region in D and E. After the region of interest was selected (purple box in D), we applied our quantification protocol (F) to identify individual LDs as objects (E,F) with displayed size (Area, μm2). (F) Scale arrow, 45 μm.The selected slice shows a medium (green arrow) and a large LD (black arrowhead, E,F). (G) Representative confocal images of fixed 6 dpf Tg(-4.5fabp2:DsRed) GF and CONVD zebrafish fed a control diet and incubated with BODIPY-FL C5 for 3 hr. The lumen is at the top and epithelium at the bottom of all images. Scale bar, 20 μm. Intestinal epithelial cells are identified by DsRed expression, and BODIPY-C5 is detected in the epithelium as small LDs and in the lamina propria (arrow; A). (H and I) The LD quantification assay described above was used to determine LD number (H) and relative size frequency (I) in an epithelial region of interest (7500 μm2). The graphs represent the mean ± SEM in starved and control-fed (C-Fed) zebrafish (at least two independent experiments; 4-10 fish/condition/experiment). Results of Student’s t test corrected. |
|
related to Figure 3. Comparison of Feeding Behavior, Growth Rates, GI Tract Organ Size and Digestive Function between 6 dpf GF and CONVD Zebrafish (A) A fluorescent bead-eating assay was used to determine the feeding behavior of 6 dpf GF and CONVD zebrafish reared under different dietary conditions. We counted the number of fluorescent microspheres in the intestines of individual fixed zebrafish. Zebrafish under the tested microbial and dietary conditions contained similar number of ingested beads. The results show individual samples and the means from two independent experiments. (B) Body size was determined by measuring the length from the snout to the end of the notochord (standard length). The graph represents means from at least two independent experiments. (C-E) Transgenic zebrafish lines were used to measure the area of GI tract organs – liver, pancreas and pancreatic islet. We used the Tg(lfabp:DsRed; elaA:GFP) line (C,D) to determine the size of the liver and pancreas. Scale bar, 200 μm. We used Tg(in3.2-Mmu.Fos:GFP)nc15 fish to measure the area of the single pancreatic islet (E). Scale bar, 50 μm. (F-H) Quantification of area size for liver, pancreas and islet. Measurements were collected from two independent experiments. The data analysis was performed in ImageJ and shows no significant effects of the microbiota or diet on the morphology of liver (F), pancreas (G) and the islet (H) in 6 dpf zebrafish. Each circle represents results from a single animal. Student’s t tests adjusted with Bonferroni’s correction for multiple comparisons revealed no significant differences. (I) Representative images of live 6 dpf GF and CONVD zebrafish fed a control diet that were simultaneously soaked in quenched PED6 and EnzChek (EC) substrates for 3 hr. Brightfield images show the intestinal region of GF and CONVD zebrafish. Overexposed images of unquenched PED6 show fluorescence in the intestinal lumen and gallbladder of GF and CONVD zebrafish (arrowhead). Overexposed images of unquenched EnzChek shows that TxRed signal is primarily detected in the intestinal lumen. Scale bar, 200 μm. (J,K) Box-and-whiskers plots of total intestinal fluorescence in GF and CONVD zebrafish under three dietary conditions. The fluorescence signal was quantified using underexposed images in ImageJ software as integrated density (area x mean fluorescence). The data were normalized to the mean of the GF starved condition for each substrate. PED6 (J) and EnzChek (K) normalized integrated densities show reduced fluorescent signal in CONVD zebrafish fed LC or C diet compared to their GF controls. Results of Student’s t test corrected with Bonferroni’s method for multiple comparisons: *, p<0.05; **, p<0.01; ***, p<0.001. 

|