
- Title
-
How variable clones build an invariant retina
- Authors
- He, J., Zhang, G., Almeida, A.D., Cayouette, M., Simons, B.D., and Harris, W.A.
- Source
- Full text @ Neuron

In Vivo Mosaic Labeling of Single RPCs (A) A schematic of the retina and its major cell types. (B) Experimental flow of labeling and tracking a retinal clone from a photoconverted single RPC (magenta). (C) Single RPCs (magenta) photoconverted at 24 hpf from the clones of various size (green). (D–F) Single RPCs photoconverted at 24 hpf (D), 32 hpf (E), and 48 hpf (F) (magenta, left) and resultant clones (magenta, right) with cell fates identified (Figure S1). Scale bar represents 5 μm. |
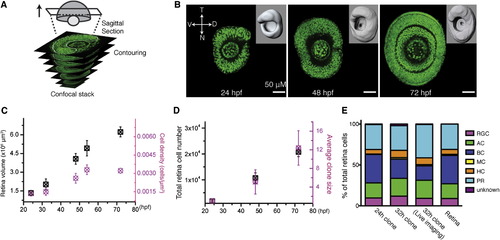
Retinal Clones Represent Retinal Growth (A) A schematic diagram of the retinal surface creation by contouring in sagittal sections (white dashed lines) of a confocal stack. (B) Representative images of the sagittal sections and the created retina surfaces (inserts) at distinct developmental stages. (C) Retinal volume (black) and average cell density (magenta) increase over time. Values are represented as mean ± SD (n = 8, 7, and 5 for the retinas at 24, 48, and 72 hpf). (D) Clone growth (magenta, photoconverted at 24 hpf) matches retina total cell growth (black) over time. Values are represented as mean ± SD (n = 8, 7, and 5 for the retinas at 24, 48, and 72 hpf). (E) Seventy-two hour postfertilization cell compositions of the clones photoconverted at 24 (24 hr clones, n = 64) and 32 hpf (32 hr clones, n = 169; 32 hr clone in live imaging, n = 67) are comparable to that of the retina. |

Stochasticity in Retinal Clone Growth (A) Sagittal slices of a geminin-GFP-expressing retina at various time points (yellow arrow points to region of highest number of mAG-zGem-labeled RPCs and magenta arrow points to region of geminin-GFP decline. (B) Quantified geminin-GFP-positive cells over time by zone (nasal or temporal zone) and depth (the distance between the most peripheral section and the section of interests). (C) Schematic showing the progression of the proliferative wave from the nasal region to the temporal region. On the right is plotted how the stochastic model (see Experimental Procedures) predicts the average number of progenitors derived from a single RPC as a function of time and nasotemporal position in the retina. (D) The probabilities in the model for the second, third, and fourth mitosis within a lineage to occur, measured against the first mitosis. (E) The time-dependent probabilities for modes of division of RPCs in the model. (F–H) Shows fits between model predictions (cyan lines with shaded blue regions show 95% plausible intervals due to finite sampling) and size distributions (orange crosses) of clones induced at 24 hpf (F), 32 hpf (G), and 48 hpf (H). |

In Vivo Time Lapse of Retinal Clone Development (A) An image series of the generation of an eight-cell clone from a single RPC photoconverted at 32 hpf (magenta). (B) The schematically reconstructed lineage tree for the clone in (A). (C) Summary of 60 complete retina lineages induced at 32 hpf reconstructed from in vivo live imaging. Dashed lines indicate clones in which the first division happened between photoconversion and start of time lapse. (D) The normalized rates of different division modes evolve over time, derived from the lineages recorded in (C), compared to model prediction (dashed lines in bottom panel). (E) The bar graph shows the length of cell cycle that leads to the three division modes. PP, symmetric proliferation; PD, asymmetric differentiation; DD, symmetric differentiation. Values are represented as mean ± SEM (n = 28, 16, and 118 for PP, PD, and DD, respectively; *p < 0.05, **p < 0.05; Student’s t test). (F) The division time of sister RPCs (t1 and t2) within the time window of 24 and 72 hpf, indicating the synchrony of sister divisions. (G) The correlation between sizes of sister lineages (orange crosses) compares well with the expected correlation due to synchronization of second mitosis induced by proximity in space and time of sister RPCs (cyan). |
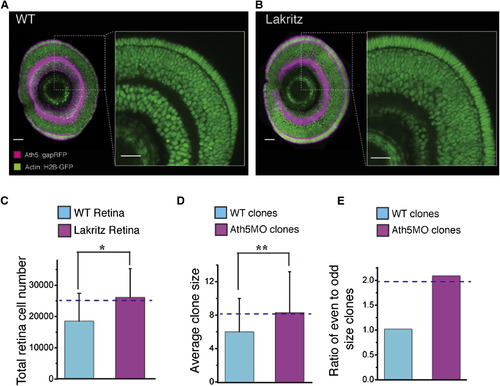
Total Retinal Cell Number Increase in Ath5 Mutants Predicted by Modeling (A and B) Zoomed-in images of a retina sagittal section of wild-type (WT) (A) and lakritz (B) retina, showing cell number increase in the lakritz retina. Scale bar represents 23 µm. (C and D) Quantified increase in total cell number in the lakritz retina (C) and the average clone size in Ath5 morpholino (Ath5MO)-injected retinas (D). The dashed lines represent the model prediction. Values are represented as mean ± SD (n = 4, WT retina; n = 3, lakritz retina; n = 169, clones in the WT retina; n = 34, clones in the Ath5MO-injected retina; *p < 0.05, **p < 0.05, Student’s t test). (E) Ath5MO-injected clones are biased toward even numbers, as predicted by the model (dashed line). |
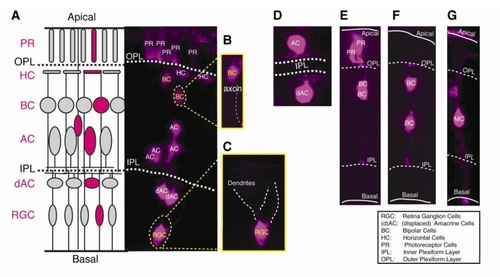
Retinal cell type identification. Distinct cell types are idcmified by the layer position and cell morphorlogy, which could be unambiguously examined in 3D reconstruction ofa clone, as shown in the Movie S I. (A) A schematic digram of the anatomical retinal structure (left) and a representative retinal clone expressing the photoconverted Kaede (right). (B,C) Zoomed Be and RGC in the clone (A, right). (D) An example oran AC and a displaced AC. (E) An example of two PRs and two BCs. (F) An example of two BCs. (G) An example of one Me. |

In vivo labeling of single retinal progenitor cells (RPCs). (A) A picture showing the setup for in vivo single-cell electroporation. (B) A single RPC electroporated with Dextran-Alexa 488 dye at 24 hpf. (C) A schematic diagram showing cell transplantation between a donor and host embryo. (D) Single RPC expressing gapGFP and H2B-RPF in a 24 hpf host retina following transplantation. (E) Plot showing that the clones generated by these different labeling methods grow in size in an indistinguished manner, which is further comparable to total cell number growth of retina tissue over development. However, significant cell loss was observed in MAZe-nlsRFP expressing clones, in which the average clone size decreases after 48hpf, finally dropping to 2.8 cells at 72 hpf(n=395), While, it is unclear why MAZe-nlsRFP labelled cells appear to die after 48hpf, this anomalous result emphasizes why it is critical to test the representativeness of clones induced by any labeling method if one is to conduct a rigorous clonal analysis of tissue development. (F) The size of 32 hpf-induced clones in live imaging is comparable to that of the 32h clones in the stain and fix experiment, and retina tissue growth. Values represent mean ± SD (n=71, 169, 4 for live imaging clones, 32h fixed clones and retina, NS, not significant). (G) Representative 3D reconstruction of a 24 hpf retina in which all the cell nucleus were recognized (Magenta color) by creating surface for every nucleus using Imaris. (H) Bar graph showing the total cell number of the 24 hpf retina measured by the cell number estimation protocol (left, Estimation-based) described in Method and the discontinuous surface-based approach (right, lmaris-based). Values represent mean ± SD (n=8, cell estimation-based protocol; n=4, Imaris-based method; NS, no significance; p > 0.05; Students′ t test). N: nasal; T: temporal; V: ventral; D: dorsal. All the cells express H2B-GFP. |

Development of retinal clones derived from single RPCs photoconverted at 32 hpf. (A-D) Time series of two 3-cell, one 5-cell, one 8-cell clones generated from single RPCs (in Magenta), in which every division and cell fate are recorded (shown in the schematic reconstructed trees in (E-H). (I) Time lapse of retinal clones from 24 to 48 hpf. Shows reconstructed lineages from early (24-48 hpf) live imaging movies using MAZe fish. Dashed lines show Ihe clones which come from labelled RPCs that had already divided once by the time we began imaging. |