
- Title
-
TNF receptors regulate vascular homeostasis through a caspase-8, caspase-2 and P53 apoptotic program that bypasses caspase-3
- Authors
- Espín, R., Roca, F.J., Candel, S., Sepulcre, M.P., González-Rosa, J.M., Alcaraz-Pérez, F., Meseguer, J., Cayuela, M.L., Mercader, N., and Mulero, V.
- Source
- Full text @ Dis. Model. Mech.

Genetic depletion of TNFRSF1B results in endothelial cell apoptosis and blood circulation disruption. (A) Scheme showing the main vessels of a 3-day-old zebrafish larvae. (B-G) Lateral view of 54(B) and 72 (C-F) hpf and tranverse and sagittal sections (G, bottom panels) of double transgenic fli1a:eGFP and gata1:dsRed larvae microinjected at the one-cell stage with standard control (STD-mo) and TNFRSF1B MOs. (B)TNFRSF1B depletion results in impaired differentiation of the CA and CV during the first sprouting, leading to blood pooling (bp) inside an enlarged unique dorsal vessel (asterisk). (C,D) At 72 hpf, blood pooling can still be observed in the caudal body part. In addition, hemorrhages appear throughout the body (arrowheads). (E,F) Zoomed views of trunk vasculature of 72 hpf larvae. TNFRSF1B deficiency results in the alteration of the second sprouting leading to the formation of a net of vessels that replace the CA and CV (E,F) and altered development of ISV (E). Arrows indicate ISA without blood circulation. (G,H) Confocal Z-stack sections of whole larvae (G) and sections (H) of the CHT of 60 hpf Tg(fli1a:eGFP) injected with standard and TNFRSF1B MOs showing TUNEL-positive cells (red) (arrowheads). Nuclei were counterstained with DAPI (blue). (I) Quantification of TUNEL-positive non-endothelial cells (eGFP) and endothelial cells (eGFP+) at 60 hpf from serial Z-stack sections. Each dot represents the number of TUNEL-positive cells per single larvae. The mean ± s.e.m. of the TUNEL-positive cells for each group of larvae is also shown; ***P<0.001. Scale bars: 100 μm unless otherwise indicated. CA, caudal artery; CV, caudal vein; CHT, caudal haematopoietic tissue; DA, dorsal aorta; DLAV, dorsal longitudinal anastomotic vessel; IPV, intersegmental primary vessels; ISV, intersegmental vessels; PCV, posterior cardinal vein; SIV, subintestinal vessels. PHENOTYPE:
|

A crucial balance between TNFRSF1A and TNFRSF1B signaling is required for endothelial cell development and maintenance. (A-D) Zebrafish embryos were microinjected at the one-cell stage with standard (STD-mo) and TNFRSF1B MOs alone or in combination with the indicated mRNAs. At 72 hpf, the vascular defects were scored. Larvae revealing no defects were scored as wild type (white), larvae showing erythrocyte accumulation in the CHT, partial blood circulation and hemorrhages were scored as mildly affected (gray) and larvae displaying erythrocyte accumulation in the CHT and no blood circulation as severely affected (black). (A) Effect of wild-type and antisense TNFRSF1B mRNA overexpression in morphant embryos. Note that wild-type, but not antisense TNFRSF1B mRNA partially rescues the TNFRSF1B morphant phenotype (B) Partial rescue of the vascular defect promoted by genetic depletion of TNFRSF1B by TNFRSF1A depletion. (C) NEMO-mediated activation of NF-ºB partially rescues the vascular defect promoted by genetic depletion of TNFRSF1B. (D) mRNA quantification of the indicated genes were determined by real-time RT-PCR in 10 pooled larvae. The gene expression is normalized against rps11 and are representative of two independent experiments. Each bar represents the mean + s.e.m.; *P<0.05, **P<0.01, ***P<0.0001; n.s., not significant according to Chi-square contingency (A-C) or Student′s t-tests (D). EXPRESSION / LABELING:
|
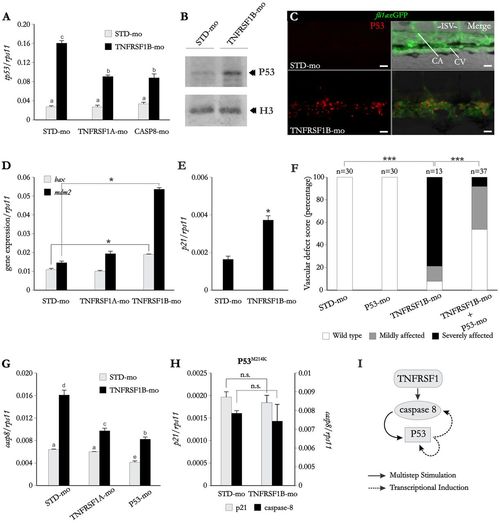
P53 activation is indispensable for promoting caspase-8-dependent apoptosis of endothelial cell in TNFRSF1B-deficient zebrafish. (A-H) Wild-type (A,B,D-G), transgenic fli1a:eGFP (C) and P53M214K (H) zebrafish embryos were microinjected at the one-cell stage with standard, TNFRSF1 A, TNFRSF1B and P53 MOs. At 72 hpf, the mRNA levels of the indicated genes were determined by real-time RT-PCR in 10 pooled larvae (A,D,E,G,H). The gene expression is normalized against rps11, each bar represents the mean + s.e.m. Different letters denote statistically significant differences among the groups according to a Tukey test. *P<0.05; n.s., not significant according to Chi-square contingency (F) or Student′s t tests (D,E,H). (A) Co-injection of TNFRSF 1A or CASP8 MOs reduces TNFRSF1B-MO-mediated P53 upregulation. (B) P53 protein levels were assayed by western blot in dechorionated and deyolked embryos at 24 hpf. Note that P53 levels are upregulated in TNFRSF 1B-deficient larvae. (C) Whole mount immunohistochemistry against P53 at 3 dpf in Tg(fil1a:eGFP) larvae injected with standard or TNFRSF1B MOs. Note a massive increase in P53 expression (red) in the vascular endothelium (green) of TNFRSF1B-deficient larvae. (D,E) TNFRSF1B silencing leads to upregulation of box, mdm2 and p21. (F) Vascular defects in larvae deficient in both TNFRSF 1B and P53 were scored as indicated in the legend to Fig. 2. Note that P53 deficiency partially rescues the vascular defects observed in TNFRSF 1B-deficient fish. (G) Upregulation of caspase-8 by TNFRSF 1B deficiency is dependent on TNFRSF 1A and P53. (H) p21 mRNA levels in P53 mutant larvae are not altered by TNFRSF 1B silencing. (I) Representation of the proposed amplification loop between extrinsic and intrinsic apoptotic pathways triggered by TNFRSF 1A. CA, caudal artery; CV, caudal vein; ISV, intersegmental vessels. Scale bars: 25 μm. EXPRESSION / LABELING:
|

Expression of tnfrsf1a, tnfrsf1b and their ligands tnfa and lta during zebrafish embryonic and larval development. (A) The mRNA levels of the gene encoding the TNFRs (tnfrsf1a and tnfrsf1b) and their ligands (tnfa and lta) were determined by real-time RT-PCR in 10-30 pooled larvae at the indicated times. The gene expression is normalized against rps11, each bar represents the mean ± S.E. of triplicate readings from pooled larvae and the data are representative of three independent experiments. ND: not detected. (B) tnfrsf1a and tnfrsf1b whole-mount in situ hybridization (ISH) (a-h) and ISH on sagittal sections (i-m). Embryonic stages and used antisense riboprobes were as indicated in each panel. Anterior is to the left, dorsal to the top in all panels except in i, where dorsal is to the left. (a,b and e,f). Note that in general, the expression pattern is rather ubiquitous. tnfrsf1a expression did not appear to be restricted to the vascular endothelium (arrow in k marks intersegmental vessel). A stronger expression of tnfrsf1b could be observed in the head mesenchyme (arrow in l). hpf, hours postfertilization; nt, notochord; s, somite. Scale bars, 100 μm. |
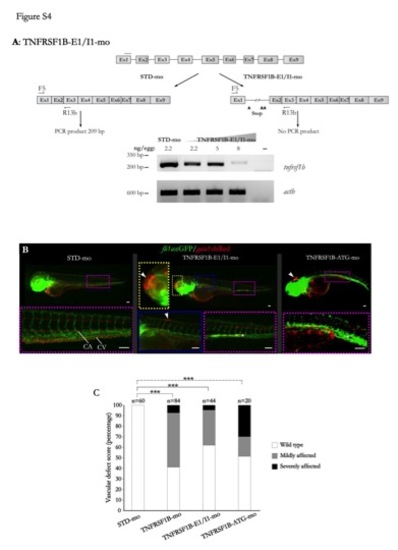
Validation and effects of two additional MOs targeting zebrafish TNFRSF1B. (A) RT-PCR analysis of TNFRSF1B-E1/I1-mo induced altered splicing of the tnfrsf1b transcript at 3 dpf. A dose-dependent decline of the wild type RNA was observed, suggesting the insertion of intron 1, which has 15,726 bp length. This insertion resulted in a predicted TNFRSF1B protein lacking both TNFα binding and signaling domains. Samples without template (-) gave no amplifications. The annealing of MO (dashed line) and the inframe premature stop codons (arrowheads) are indicated. (B) Embryos injected with 8 ng/egg (1 mM) TNFRSF1B-E1/I1-mo (middle panel) or TNFRSF1B-ATG-mo showed impaired differentiation of the caudal artery (CA) and caudal vein (CV) (asterisks), hemorrhages throughout the body (arrowheads) and altered blood circulation. A control larvae injected with STD-mo is shown on the left panel for comparison. Scale bars, 100 μm. (C) The vascular defects shown in (B) were scored at 72 hpf as indicated in the legend to Figure 2. ***P<0.0001 according to Chi-square contingency test. PHENOTYPE:
|

Confirmation of the vascular defects promoted by genetic depletion of TNFRSF1B using a DN mutant form. (A) Representative embryo injected with 200 ng/egg DN TNFRSF1B (right panel) showed impaired differentiation of the caudal artery (CA) and caudal vein (CV). Note the interruption of the CA (arrow) and blood pooling in the altered CV (asterisks). A control larva injected with 200 ng/egg antisense mRNA is shown on the left panel for comparison. Scale bars, 500 μm. (C) The vascular defects shown in (A) were scored at 72 hpf as indicated in the legend to Figure 2. ***P<0.0001 according to Chi-square contingency test. |