
- Title
-
Coupling mechanical deformations and planar cell polarity to create regular patterns in the zebrafish retina
- Authors
- Salbreux, G., Barthel, L.K., Raymond, P.A., and Lubensky, D.K.
- Source
- Full text @ PLoS Comput. Biol.

Cone mosaics in the embryonic, larval, and adult zebrafish retina. A) Schematic of photoreceptor packing in the apical plane of the adult retina, showing cones of red, green, blue, and UV (magenta) spectral sensitivities, and smaller rods (black). The 12-cell repeating motif of the cone mosaic pattern is outlined by the yellow rectangle. B) Regular pattern of cones visualized in a flat-mount retinal preparation from an adult, double transgenic zebrafish (mi2009 line) in which UV and blue cones express different fluorescent reporters (pseudocolored magenta and blue) under the control of UV and blue opsin promoters, respectively. Apical boundaries of cells are delineated by ZO-1 immunostaining (yellow). Horizontal rows of alternating blue and UV cones alternate with horizontal rows of unlabeled cone profiles representing red-green double cone pairs. C) Rod photoreceptors are visualized in a flat-mount retinal preparation from an adult transgenic zebrafish (kj2 line) in which the rod opsin promoter drives expression of a reporter gene (pseudocolored cyan). Apical boundaries of cells are delimited by ZO-1 immunostaining (yellow). Rods are largely excluded from the vertical columns of contiguous cones, and instead occupy the spaces between adjacent columns. D) Schematic of the hemispherical retinal epithelium. Retinal neurogenesis in the circumferential germinal zone at the peripheral margin adds annuli of new retinal neurons, such that the age of retinal cells is a direct function of their distance from the periphery. The ordered cone pattern illustrated in panels A–C is in the peripheral retina, whereas the central retina, surrounding the pole of the hemisphere, exhibits the disordered embryonic/larval pattern (panel E), with a transition zone in-between (panel G). The annular ligament (not shown) roughly encircles the germinal zone. E) Apical retinal surface of a double transgenic mi2009 zebrafish at 4 days post-fertilization, showing the packing of cone cells that differentiated during embryonic development, before progressive addition of cones at the retinal margin begins: UV cones are magenta, blue cones are blue, ZO-1 immunostaining (yellow) outlines cell profiles at the level of the OLM. F) Average orientational order parameter Q4 (Fig. 2 and Methods) for embryonic and adult retina. (Three and six regions of ~20 by 15 cone cells were used to calculate the values for embryonic and adult retina, respectively.) G) Transition from disordered cell packing in the larval remnant (left side) to ordered packing (right side) in a flat-mount retina of an adult double transgenic zebrafish, mi2009 labeling blue and UV (magenta) cones, with cell boundaries visualized with ZO-1 immunostaining (yellow). The curved, dashed line segment traces a cone column. H) High magnification views of the angles at which three cone-cone interfaces meet (ZO-1 in yellow). |

Generation of cone photoreceptors in larval and adult fish. A) Top: developmental time is indicated from right to left. Neuroepithelial progenitor cells in the retinal germinal zone proliferate, exit the cell cycle, and differentiate into cone photoreceptors, Müller glia (shaded grey), and retinal neurons (not shown). Rod photoreceptors are later added to the differentiated retina (left). The apical epithelial surface of the retina (cyan line) is the outer limiting membrane (OLM), as defined by the zonula adherens (ZA). The junctional protein Zonula Occludens (ZO-1) localizes to the OLM. The subapical region (SAR) of the plasma membrane shown in red is in the inner segment of the photoreceptors and is the site of localization of the Crumbs complex. The outer segments of photoreceptors contain the rod and cone opsins and are colored to represent the wavelength absorption maxima of their respective visual pigments. Bottom: the dotted rectangle indicates the retinal margin region illustrated in panels B and D, which straddles the proliferative germinal zone and the adjacent zone of differentiating cones. B) Larval retinal margin with cell boundaries at the level of the zonula adherens indicated by ZO-1 immunostaining, showing the packing of cone cells added through growth at the margin during the larval stage. The germinal zone is at the right. C) The Q4 orientational order parameter from the image in panel B is plotted as a function of distance from the proliferating germinal zone (at ~15 μm). D) Adult retinal margin; note that straight vertical columns of cones appear abruptly at the edge of the germinal zone and represent a cohort of cells generated approximately synchronously from the germinal zone at the right. The polygonal profiles marked by white stars represent profiles of Müller glia (see Fig. S1J, L). E) The Q4 orientational order parameter from the image in panel C; note that the value of Q4 increases sharply at the edge of the germinal zone (at ~15 μm) in the adult retina. |

Model rationale and main ingredients. A) Cell boundaries at the level of the zonula adherens of the larval retina are revealed by ZO-1 immunostaining; note the fragments of straight, aligned rows of cones (top left, red dashed lines). We propose that this organization reflects an underlying planar cell polarity (schematic, bottom left): polarity proteins (dark blue lines) accumulate on certain interfaces, lowering their tension and leading to cell polarization (arrows). Without a global ordering signal, domains of aligned cell polarity (red dashed lines) appear. In the presence of a global ordering signal, all cones polarize in the same direction (bottom right) leading to the observed rectangular lattice and columns of cones in the adult retina (top right). B) Model ingredients: Cell shape is determined by interfacial tensions γ and pressures P; tensions must balance at vertices in mechanical equilibrium (green arrows, top left). Proteins A and B define planar cell polarity (top right) and prefer to collect on shorter interfaces (bottom right). Interfacial tensions depend on polarity protein concentrations c (bottom left). |
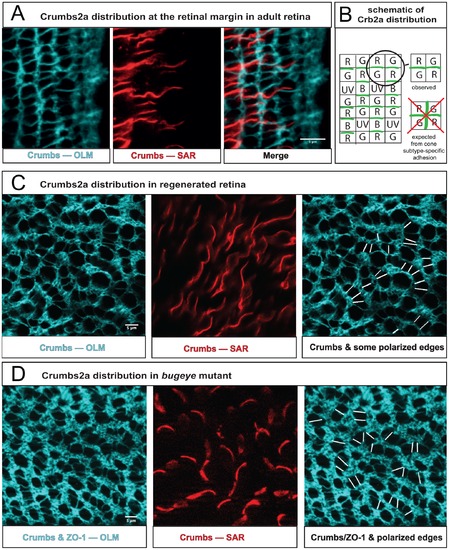
Planar cell polarity in intact and regenerated retina. A) Crb2a protein localized by immunocytochemistry in a flat-mount preparation at the margin of the adult retina (germinal zone to the right). The focal plane is at the level of the zonula adherens/OLM (left panel, projection of 12 confocal z slices, cyan); at the level of the inner segments/SAR of cone photoreceptors (middle panel, single confocal z slice, red); an overlay of both panels (right). See also Fig. S4J–L. B) Schematic illustrating Crb2a distribution along cone-cone interfaces within a column at the level of the SAR. Note that Crb2a does not localize to the orthogonal interfaces between adjacent cones across columns, as would be expected if Crb2a mediated unpolarized, but spectral-subtype-dependent, interactions between cones. C) At the level of the OLM, cone photoreceptors (large profiles) in regenerated retina are not organized in a rectangular lattice, but aggregate into short chains one cell wide, indicating polarized interactions (left panel). The planar polarized interfaces are verified by Crb2a localization in the SAR of these cones (middle panel). By tracing the Crb2a signal through successive focal planes in the Z-stack some planar polarized SAR interfaces between cone inner segments were associated with the corresponding cone-cone interfaces at the OLM, as indicated by white line segments (right panel). D) At the level of the OLM, cone profiles in the adult bugeye mutant are organized similarly to the regenerated retina, here visualized with a cocktail of antibodies against ZO-1 and Crb2a (left panel). Again similar to the regenerated retina, Crb2a localizes to planar polarized SAR interfaces between cone inner segments (middle panel), and some of these were traced to the cone-cone interfaces at the OLM (right panel). |

Identification of cell profiles at the apical surface of the adult zebrafish retina. A–C) Retinal flat-mount from a young adult transgenic zebrafish (ucd1) in which the cone transducin alpha promoter drives expression of the EGFP reporter. A, C) All cones are green. B, C) cell boundaries at the level of the OLM are labeled with ZO-1 (white). B) UV cones (magenta stars) can be recognized by their large apical profiles relative to the other cones and rods. Red-green double cone pairs within a vertical column are tightly apposed with flattened interfaces (white arrows in B and also in E and H). D–F) Retinal flat-mount from a young adult transgenic zebrafish (kj2) in which the rod opsin promoter drives expression of the EGFP reporter. D, F) All rods are green. E, F) Cell boundaries at the level of the OLM are labeled with ZO-1 (white). F) The initial rods insert between vertical cone columns at the intersections between red, green, blue and UV cones in adjacent columns. G–I) Retinal flat-mount from an older adult rod transgenic zebrafish (kj2). Rods continue to accumulate between adjacent vertical cone columns. J–L) Flat-mount at the margin of the retina from a young adult transgenic zebrafish (mi2002) in which the promoter from the glial-specific gene, gfap, drives expression of the EGFP reporter in Müller glial cells. The germinal zone is at the right. J, L) Müller glia cells at the apical surface (green); thin lamellar processes completely surround all rod and cone photoreceptors at the OLM, and Müller glia also account for the polygonal profiles in the germinal zone and adjacent region where cones are differentiating (magenta arrows in K and L; also see Fig. 3A). |
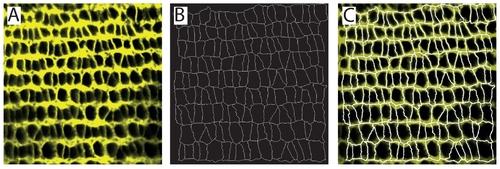
Example of the segmentation procedure. A) Original image, B) Segmentation result, C) Overlay (original image has been darkened and segmentation lines thickened for visualization purposes). |
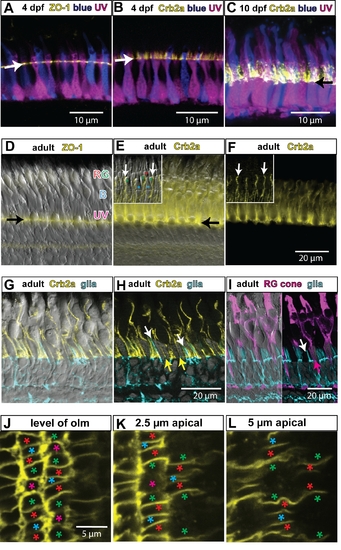
Differentiation of cone photoreceptors and elaboration of the apical process. A) Retinal cryosection from larval transgenic (mi2009) fish at 4 days post-fertilization (dpf), in which blue and UV cones express the reporters mCherry and EGFP (pseudocolored blue and magenta, respectively), which fill the cytoplasm of the cells. The OLM (arrow) is labeled by ZO-1 immunostaining (yellow). The developing inner and outer segments of the cones project apically beyond the OLM. B) Larval mi2009 fish at 4 dpf immunolabeled for Crb2a (yellow). Note that the Crb2a protein extends beyond the OLM (arrow) on the plasma membrane of the inner segments. C) By 10 dpf, the cone inner and outer segments have elongated further and the Crb2a protein also extends further apically on the inner segments. The arrow indicates the level of the OLM. D) Differential interference contrast (DIC) image of a retinal cryosection from an adult zebrafish, immunolabeled with ZO-1 (yellow) to label the OLM (arrow). The inner and outer segments of cones extend apically; the UV cones are the shortest, the blue (B) cones are longer, and the red and green (RG) double cones are the longest. E) A DIC image with immunolocalization of Crb2a protein on the inner segments of the cones. The black arrow indicates the OLM. The inset shows the Crb2a protein at the interface between red and green double cones (white arrows). F) Same image as panel E without the DIC channel. G) Differential interference contrast (DIC) image of a retinal cryosection from an adult transgenic zebrafish (mi2002), expressing a fluorescent reporter in Müller glia (cyan), and immunolabeled with Crb2a (yellow). H) Same image as panel E without the DIC channel. The processes of Müller glia (white arrows) extend apically beyond the OLM, but not as far as the Crb2a (yellow). Müller processes do not separate the interface between the inner segments of red and green double cone pairs, which have strong staining for Crb2a (yellow arrows). I) Left half: DIC image of a retinal cryosection from an adult transgenic zebrafish (mi2002), expressing a fluorescent reporter in Müller glia (cyan), and immunostained with zpr1, which labels red and green cones (magenta). Right half: same image without the DIC channel. The processes of the Müller glia (white arrow) are not interposed between the inner segments of red and green double cone pairs (magenta arrow). J–L) Individual optical sections from a z-stack confocal image of Crb2a immunolabeling near the retinal margin in a retinal flat-mount (cropped version from the same image series shown in Figure 6A). Panel J is at the level of the OLM, panel K is the subapical region (SAR) at 2.5 μm from the OLM, and panel L is the SAR at 5 µm from the OLM. Identity of cone photoreceptor subtypes is indicated by asterisks: red, green, blue, and UV (magenta), respectively. In the SAR, Crb2a has a planar polarized distribution – it is expressed at higher levels at the interfaces of red, green, and blue cones within a column. The retinal surface is curved, so the left and right sides of each panel are more apical than the center (and thus show a somewhat more polarized Crb2a distribution in J and K). |