
- Title
-
Topology and dynamics of the zebrafish segmentation clock core circuit
- Authors
- Schröter, C., Ares, S., Morelli, L.G., Isakova, A., Hens, K., Soroldoni, D., Gajewski, M., Jülicher, F., Maerkl, S.J., Deplancke, B., and Oates, A.C.
- Source
- Full text @ PLoS Biol.

bHLH proteins in the segmentation clock interact promiscuously, but only few dimers bind DNA. (A–D) Schematic of MITOMI setup. (A) Top view of three unit cells, (B) cross-section of one unit cell. Flow layer in grey, control layer in green, supporting glass slide in blue, and spots of expression template or target DNA in red. (C) GFP-tagged Her protein is immobilized on the slide surface with anti-GFP antibodies. mCherry-tagged Her protein is expressed in the chamber in the presence of Cy5-labelled DNA and allowed to bind to the immobilized protein. (D) The valve over the detection area (black line) is actuated to displace unbound protein and DNA and detect specific interactions. (E) Representative images of six chambers of a microfluidic chip with Her7-GFP (green) coupled to the chip surface with Her7-mCherry (upper panels) or Hes6-mCherry (lower panels) expressed from expression templates spotted on the chip in the presence of a Cy5-labeled DNA oligomer. Both Her7-mCherry and Hes6-mCherry interact with Her7-GFP, but only the combination of Her7-GFP and Hes6-mCherry binds DNA. (F) Quantitative analysis of protein-protein interaction of Her7-GFP with Her1-mCherry, Hes6-mCherry, Her7-mCherry, myoD-mCherry, and PPARγ-mCherry. mCherry signal in solution is plotted against the bound signal in the detection area. The slopes of the linear fit to the data points for each mCherry-tagged protein provide relative measures of their interaction strengths with Her7-GFP. (G) Relative strength of protein-protein interactions between Her1, Her7, Hes6, myoD, and PPARγ assayed as in (F), with Her7-GFP (left), Hes6-GFP (middle), or Her1-GFP (right) coupled to the chip surface. Bars represent the slopes ± standard error of the linear fits as shown in (F), with the slope of the strongest interaction normalized to one for each experiment. (H) Quantitative analysis of DNA binding activity of Her7 homo- and heterodimers. mCherry signal in solution is plotted against signal of bound DNA in the detection area; the slopes of linear fits to the data give a relative measure of the DNA binding activity of the different bHLH dimers. (I) Relative DNA binding activity of dimers formed between Her1, Her7, Hes6, and myoD assayed as in (H), with Her7-GFP (left), Hes6-GFP (middle), or Her1-GFP (right) coupled to the chip surface. Bars represent the slopes ± standard error of the linear fits as shown in (H), with the slope of the strongest interaction normalized to one for each chip. |
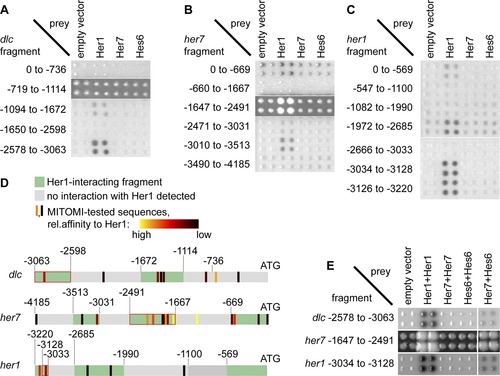
Interaction of Her1 and Her7:Hes6 with her1, her7, and dlc promoter fragments in a yeast one-hybrid assay. (A, B, C) 18 yeast strains carrying promoter fragments of the dlc (A), her7 (B), or her1 (C) genes coupled to His- and lacZ-reporter genes were transformed with plasmids encoding N-terminally Gal4-AD tagged Her1, Her7, or Hes6. Protein-DNA interactions were detected by staining for β-galactosidase, except for two fragments from the her7 promoter (1647 to 2491) and dlc promoter (719 to 1114), where self-activation precluded use of the β-gal assay and interactions were detected by growth in the presence of 3-aminotriazole. Colonies were arrayed in quadruplicates to aid identification of positives. Numbers indicate start and end of fragments relative to the gene′s start codon in the genome. (D) Comparison of MITOMI and yeast one-hybrid results. Promoter fragments are depicted by grey and green horizontal bars, with start codon to the right. Fragments displaying interaction with Her1 are in green, and fragments without interaction with Her1 are in grey. Vertical bars indicate H-box sites. Relative binding affinity of each H-box to Her1 as determined by MITOMI is color-coded from black (low affinity) to yellow (high affinity). For relative affinities of individual sites, see Table S1. Numbers indicate distance from start codon. (E) Bait strains were transformed with pAD-DIMER vectors encoding two copies of AD-tagged her1, her7, or hes6 or a combination of her7 and hes6 and interactions detected as in (A–C). Only one fragment each from the her1, her7, and the dlc promoter gives signals with Her1 only expressed from pAD-DIMER, and the same fragments interact with a combination of Her7 and Hes6. |
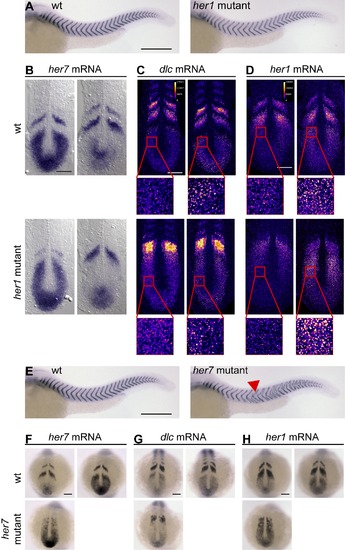
Genetic mutants indicate that her7 and her1 have distinct functions. (A) Wildtype (wt, left) and her1 mutant (right) embryos at 34 hours post fertilization (hpf) stained for cb1045 expression to visualize segmentation. Anterior segmentation defects in her1 mutant embryos were of variable severity, and a representative embryo is shown. See Figure S4D for a quantitative analysis of segmentation defects in her1 mutants. (B–D) wt (upper row) and her1 mutant (lower row) embryos at the 10-somite stage in situ stained for her7 (B), dlc (C), or her1 (D) mRNA expression. her1 and dlc expression patterns (C and D) were visualized using tyramide chemistry and displayed in FIRE lookup table to distinguish onset of expression waves (high intensity punctate signal in insets) from later phases of the oscillation cycle (punctae with lower intensity or diffuse signal). (E) wt (left) and her7 mutant (right) embryos at 34 hpf stained for cb1045 expression to visualize segmentation. Red arrowhead points to anterior-most segmentation defects in her7 mutants. (F–H) wt (upper row) and her7 mutant (lower row) embryos at the 10-somite stage in situ stained for her7 (F), dlc (G), or her1 (H) mRNA expression. (A) and (E–H) are whole mount preparations, and (B–D) are flat mount preparations. (B–D) and (F–H) Two representative examples per condition are shown to illustrate oscillatory expression, except for her7 mutants (F–H). Scale bar: 300 μm for (A and E), and 100 µm for all other panels. |
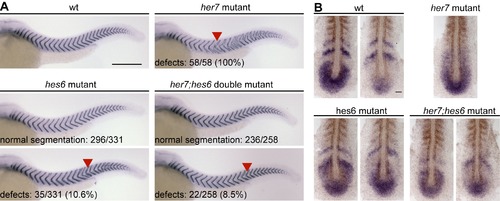
The hes6 mutant phenotype is epistatic to the her7 mutant phenotype. (A) Wildtype (wt, upper left), her7 mutant (upper right), hes6 mutant (lower left), and her7;hes6 double mutant embryos (lower right) at 34 hpf stained for cb1045 expression to analyze segmentation. Posterior segmentation defects (red arrowheads) are fully penetrant in her7 mutants, but not in hes6 mutant and her7;hes6 double mutant embryos. Numbers indicate number of embryos with and without segmentation defects for hes6 and her7;hes6 mutants. Whole mount preparations, anterior to the left, scale bar 300 μm. (B) wt (upper left), her7 mutant (upper right), hes6 mutant (lower left), and her7;hes6 double mutant embryos (lower right) at the 10-somite stage in situ stained for her7 expression (blue). Formed segments are labeled by staining for myoD mRNA expression (brown). Two representative examples with different expression patterns are shown for wt, hes6, and her7;hes6 mutants to indicate evidence for ongoing tissue-level oscillations. Patterns in all her7 mutants examined were similar, and one representative example is shown. Flat mount preparations, anterior to the top, scale bar 50 μm. |

Posttranscriptional Hes6 protein oscillations. (A) Wildtype (wt, left), her1 mutant (middle), and her7 mutant embryos at the 10-somite stage in situ stained for hes6 mRNA expression. (B) Intensity profile of hes6 mRNA staining in the embryos shown in (A), using the region boxed in black in the rightmost panel in (A). The origin of the graph corresponds to the end of the notochord. hes6 mRNA levels decay smoothly from posterior to anterior in wildtype, her1, and her7 mutant embryos. (C) Single confocal sections of 10-somite stage wildtype (left) and hes6 mutant embryos (right) immunostained with monoclonal antibodies raised against full-length Hes6 (yellow). Nuclei are counterstained with Hoechst 33342 (blue). Antibodies show immunoreactivity with a nuclear antigen in wildtype, but not in hes6 mutant embryos. Insets show magnified view of region boxed in red in the tailbud. (D) Widefield images of wildtype embryos at the 10-somite stage immunostained with Hes6 antibodies. Dynamic waves of Hes6 staining in the intermediate PSM (arrowheads) become apparent upon enhancing the contrast in this region (panels to the right). (E) Intensity profile of Hes6 protein staining for the embryos shown in (D) using the region boxed in white in the rightmost panel of (D). The origin of the graph corresponds to the end of the notochord. Waves of Hes6 protein levels manifest as local peaks in the staining profile (arrowheads). (F) Widefield images of her1 mutant (left) and her7 mutant (right) embryos at the 10-somite stage immunostained with Hes6 antibodies. Waves of Hes6 staining in the intermediate PSM can be observed upon contrast enhancement in her1 mutant embryos (arrowheads), but not in her7 mutant embryos. (G) Intensity profiles of Hes6 protein staining for the embryos shown in (F). Arrowheads point towards local peaks in the intensity trace indicative of protein oscillations, which can be detected for her1 mutant embryos (light and dark red traces), but not for the her7 mutant embryo (green trace). (A, C, D, F) Flat mount preparations, anterior to the top; scale bars, 50 μm. |

Promiscuous interaction between Her1, Her7, and Hes6. GFP-tagged Her1 (left), Her7 (middle), or Hes6 (right) was co-expressed with different mCherry-tagged proteins in an in vitro transcription-translation system as indicated. GFP-tagged proteins were purified by immunoprecipitation using a GFP-antibody and transferred to membranes. Probing for mCherry-tagged proteins (upper panels) reveals that all proteins containing a basic helix-loop-helix domain (i.e., MyoD, Her1, Her7, and Hes6) are co-purified with the GFP-tagged protein significantly stronger than the negative control PPARγ but that there is little difference in co-purification efficiency between different bHLH proteins. This indicates that the bHLH proteins investigated here interact promiscuously. IP, immunoprecipitation; IB, immunoblotting. |

Tissue-level transcriptional oscillations in hes6 mutant embryos. Wildtype (wt, upper row) and hes6 mutant (lower row) embryos at the 10-somite stage in situ stained for her7 (A), dlc (B), or her1 (C) mRNA expression (blue). in situ staining for myoD expression (red) marks formed somites. Flat mount preparations, anterior to the top, scale bar 100 μm. Alternating patterns indicative of tissue-level oscillatory gene expression are evident for each probe. This is in contrast to a previous study, where MO-mediated hes6 knockdown resulted in loss of oscillatory expression of her1, her7, and dlc [18]. These discrepancies could be caused by off-target effects of the MOs used in [18] or by raising the embryos at different temperatures in the two studies. Note that the embryos shown here were raised at 28.5°C, where the majority of hes6 mutant embryos segments normally [17]. |

The her1hu2124 and the her7hu2625 alleles lead to full loss of her1 and her7 function, respectively. (A) Schematic representation of the genomic organization of the her1 locus. Boxes represent exons, and lines represent introns (distances not to scale). An asterisk indicates the approximate position of a nonsense mutation in the hu2124 allele that was generated by ENU mutagenesis [28] at the Hubrecht laboratory (Netherlands). Carriers of the her1hu2124 allele are referred to as her1 mutant in this work and were homozygous viable and fertile. The mutant stop codon disrupts the bHLH domain, which is encoded within the first three exons. (B) Sequencing trace from heterozygous carriers of the hu2124 allele. The C-to-T exchange is evident, changing the codon from Ser to stop. (C) To study whether her1hu2124 lead to full loss of her1 function, wildtype (wt) and her1 mutants were injected with a combination of her1 targeted morpholino antisense oligonucleotides (MOs) or left uninjected, grown to 34 hpf, and stained with the myotome boundary marker cb1045. her1MO injection into wt and the her1 mutant results in partially penetrant anterior segmentation defects similar to the uninjected her1 mutant. Scale bars, 300 μm (big panels) and 50 μm (insets). (D) The percentage of defective posterior boundaries for each segment along the anterior trunk was determined in groups of embryos treated as in (C). Combining the mutant allele and MO-mediated knockdown does not increase the penetrance or severity of segmentation defects, suggesting that her1 function is fully lost in all three conditions. Data are pooled from two (wt) or three (her1 mutant) independent experiments. (E) Schematic representation of the genomic organization of the her7 locus. Boxes represent exons, and lines represent introns (distances not to scale). An asterisk indicates the approximate position of the nonsense mutation in the hu2625 allele that was generated by ENU mutagenesis [28] at the Hubrecht laboratory (Netherlands). Carriers of the her7hu2625 allele are referred to as her7 mutant in this work, and homozygous carriers were viable and fertile. The premature stop codon in her7 mutants is located within the HLH domain that mediates dimerization between bHLH proteins. (F) Sequencing trace from heterozygous carriers of the hu2625 allele. The A-to-T exchange is evident, changing the 38th codon of the Her7 protein from Lys to stop. (G) wt and her7 mutant embryos were injected with her7 targeted MOs or left uninjected, grown to 34 hpf, and stained with the myotome boundary marker cb1045. Segmentation defects posterior to a similar axial level (arrowhead) are evident in her7MO injected wt embryos as well as uninjected and injected her7 mutant embryos. Scale bar 300 μm. (H) The Anterior Limit of Defects (ALD) [75] was scored in groups of her7MO injected wt embryos and injected or uninjected her7 mutant embryos to exactly quantify the severity of the segmentation defects. Combination of MO-mediated knockdown and the her7 mutant allele shifts the ALD anteriorly by less than one segment. Although it cannot be excluded that this slight shift is due to the knockdown of some residual her7 activity in the mutant, these data suggest that her7 function is almost completely absent in homozygous carriers of the her7hu2526 allele. Data were pooled from two independent experiments; error bars indicate standard deviation. |
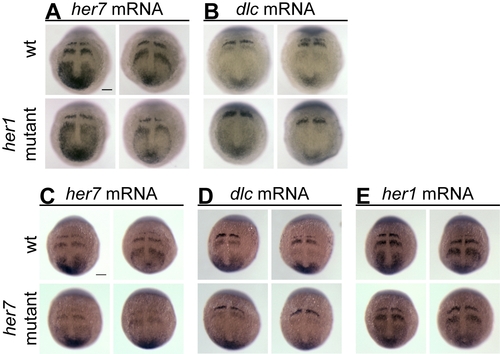
Tissue-level transcriptional oscillations in her1 and her7 mutant embryos at the bud stage. (A, B) Wildtype (wt, upper row) and her1 mutant (lower row) embryos at the bud stage in situ stained for her7 (A) or dlc (B) mRNA expression. (C–E) wt (upper row) and her7 mutant (lower row) embryos at the bud stage in situ stained for her7 (C), dlc (D), or her1 (E) mRNA expression. Two representative examples per condition shown. Alternating patterns indicative of tissue-level oscillatory gene expression are evident for each genotype and probe. Whole mount preparations, anterior to the top, scale bars, 100 μm.
|

Combined loss of her1 and hes6 or her1 and her7 function fully disrupts segmentation and tissue-level oscillatory her7 expression. (A) Wildtype (wt), her1 mutant, hes6 mutant, and her1;hes6 double mutant embryos grown to 34 hpf and stained with the myotome boundary marker cb1045 to analyze segmentation. wt and the majority of her1 and hes6 single mutant embryos segment normally along the entire axis, whereas all her1;hes6 double mutant embryos display segmentation failure along the entire axis. Scale bar, 300 µm. (B) wt, her1 mutant, hes6 mutant, and her1;hes6 double mutant embryos at the 10-somite stained for her7 mRNA expression. Alternating wave patterns indicative for tissue-level oscillatory expression can be observed for wildtype, her1, and hes6 single mutant embryos (two representative examples shown for each genotype), but 26 out of 27 her1;hes6 double mutants display an equal level of her7 expression throughout the PSM. Scale bar, 100 µm. (C) wt and her7 mutant embryos were injected with her1-targeted MOs or left uninjected, grown until 34 hpf, and stained with the myotome boundary marker cb1045 to analyze segmentation phenotypes. All wildtype and the majority of her1 morphant embryos segment normally in the central trunk and tail, whereas her7 mutants display posterior segmentation defects. These defects are enhanced by injection of her1-targeted MOs into the mutant background, which leads to segmentation failure along the entire axis. Scale bar, 300 μm. (D) Uninjected and her1-MO-injected wt and her7 mutant embryos at bud-stage stained for her7 mRNA expression. Alternating wave patterns indicative for tissue-level oscillatory expression can be observed for uninjected and her1-MO-injected wt and uninjected her7 mutant embryos (two representative examples per condition shown), but her1 MO injection into her7 mutants leads to even her7 expression throughout the PSM (40 out of 40, one representative example shown). Scale bar, 100 μm. |
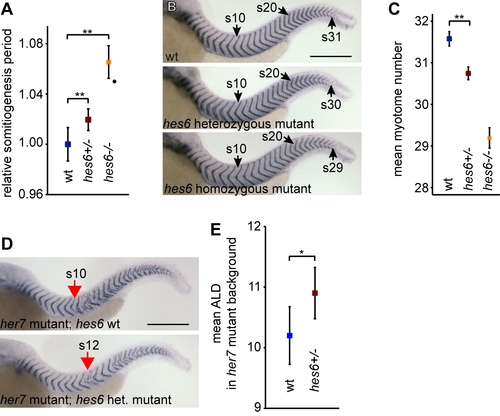
Quantitative effects of hes6 dosage on clock function. (A) Somitogenesis period measured by time-lapse imaging of embryos obtained from incrosses of heterozygous hes6 mutants. Period of wildtype (wt) embryos were normalized to one, and period of homozygous hes6 mutants is from [17], for comparison. Data pooled from three independent experiments, ne19 for each genotype. Heterozygous hes6 mutants segment 2% slower than their wt siblings, while homozygous hes6 mutants segment 6% slower. (B) wt, heterozygous, and homozygous hes6 mutants at 48 hpf stained for cb1045 expression to count myotome number. The 10th, 20th, and last myotome is indicated for each genotype. (C) Quantification of myotome number in embryos stained as in (B) from incrosses of heterozygous hes6 mutants. Myotome number was scored by an observer blind to the embryos′ genotype. Heterozgygous hes6 mutants have fewer segments than their wt siblings. Data pooled from two independent experiments, ne26 per gentoype. (D) her7 homozygous mutants with a wt or heterozygous mutant hes6 locus at 34 hpf stained for cb1045 expression to determine anterior limit of segmentation defects (ALD, red arrow). (E) Quantification of ALD in embryos from an incross of her7 homozygous;hes6 heterozygous mutants. ALDs were scored by an observer blind to the embryos′ genotype. The onset of segmentation defects in hes6 heterozygous her7 mutants is shifted toward the posterior compared to her7 mutants with two wildtype hes6 alleles. Data shown are from one representative experiment, ne15 per genotype. ** and * indicate pd0.01 and pd0.05, respectively, as determined by two-tailed Mann-Whitney U-test. Error bars indicate 95% confidence interval. Scale bars 300 μm. |