
- Title
-
Opposing Effects of Circadian Clock Genes Bmal1 and Period2 in Regulation of VEGF-Dependent Angiogenesis in Developing Zebrafish
- Authors
- Jensen, L.D., Cao, Z., Nakamura, M., Yang, Y., Bräutigam, L., Andersson, P., Zhang, Y., Wahlberg, E., Länne, T., Hosaka, K., and Cao, Y.
- Source
- Full text @ Cell Rep.

Constant Light Exposure Inhibits Developmental AngiogenesisTg(Fli1:EGFP)y1 transgenic zebrafish embryos exposed to LD (A–D), LL (A–D), or DD (C and D) were examined for ISV development at 24 hpf (C and D) or for SIV development at 72 hpf (C and D) using confocal microscopy.(A) Morphology of zebrafish embryos was examined at 24 hpf and 48 hpf under LD and LL conditions.(B) Average ± SEM somite lengths and head angles were quantified under LD and LL conditions (n = 7–9/group).(C) Zebrafish embryos were raised under LD, DD, or LL conditions from 1 hpf. Dashed lines indicate the maximal length of ISVs. Yellow dashed lines encircle the SIV. Scale bar for ISV is 50 μm and for SIV is 100 μm.(D) Quantification of the average ± SEM. ISV length (n = 52–54 embryos/group) of 24 hpf embryos and the SIV area of 72 hpf embryos (n = 48 embryos).(E) RT-PCR analysis of average zebrafish period2 (P2) expression ± SEM under LD, LL, and DD conditions (a pooled sample of 25 zebrafish embryos/group).(F) Densitometric quantification of average period2 expressions shown in (E).Bars in (A) = 500 μm. S, somite; NC, notochord; H, hindbrain; M, mesencephalon; E, eye. Blue lines in (A) indicate the head angle. p < 0.05 and p < 0.01. NS, not significant.See also Figure S2. EXPRESSION / LABELING:
PHENOTYPE:
|

Opposing Roles of Bmal1 and Period2 in Regulation of Developmental Angiogenesis(A) Zebrafish embryos received injections of specific morpholinos targeting Bmal1 (B1MO), Bmal2 (B2MO), Clock3 (C3MO), or Period2 (P2MO) (0.2 pmol/embryo) and were subsequently raised under LL or LD conditions. Scrambled morpholino (scrMO), five base-pair mismatch bmal1 (B1misMO), or five base-pair mismatch period2 (P2misMO) were used as controls. Dashed lines indicate the maximal length of ISVs. Bar = 50 μm.(B) Quantification of the average length ± SEM of ISVs in 24 hpf embryos under the LD condition (n = 8–48 embryos/group).(C) Quantification of the average length ± SEM of ISVs in 24 hpf embryos under the LL condition (n = 6–37 embryos/group).(D) Morphology of zebrafish embryos was examined at 24 hpf and 48 hpf under LD and LL conditions. Bars = 500 μm. S, somite; NC, notochord; H, hindbrain; M, mesencephalon; E, eye.(E) Quantification of average ± SEM somite lengths and head angles under LD and LL conditions (n = 7–17/group).(F) Zebrafish embryos received injections of specific morpholinos targeting Bmal1 (B1MO), Period2 (P2MO), scrambled morpholino (scrMO), bmal1 mRNA (B1mRNA), period2 mRNA (P2mRNA), B1mRNA plus B1MO, or P2mRNA plus P2MO and were subsequently raised under LD or LL conditions. Dashed lines indicate the maximal length of ISVs. Bar = 50 μm.(G) Quantification of the average length ± SEM of ISVs in 24 hpf embryos under the LD condition (n = 8–27 embryos/group).(H) Quantification of the average length ± SEM of ISVs in 24 hpf embryos under the LL condition (n = 6–28 embryos/group).(I) qPCR of average ± SEM period2 mRNA expression levels after 48 or 72 hpf LD or LL exposure (n = 3–4 × 20–50 embryos/group). p < 0.05; p < 0.01; and p < 0.001. NS, not significant.See also Figures S1 and S2. EXPRESSION / LABELING:
PHENOTYPE:
|
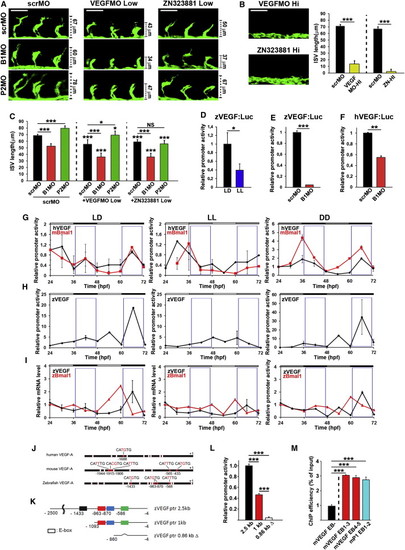
Circadian Clock Regulates Expression Levels of VEGF(A) Zebrafish embryos were injected with scrambled (scrMO) morpholino (A) or a low dose of the vegf morpholino (VEGFMO, 0.06 pmol/embryo) alone or in combinations with bmal1 (B1MO) or period2 (P2MO) morpholinos (0.2 pmol/embryo). Some embryos were treated with either DMSO vehicle or a low dose of VEGFR TKI (0.3 μM ZN323881) alone or in combinations with bmal1, period2, or scrambled morpholinos (0.2 pmol/embryo). The embryos were subsequently raised under the LD condition.(B) High doses of the vegf morpholino (0.2 pmol/embryo) or ZN323881 (1.0 μM) were also delivered to zebrafish embryos. Dashed lines in (A and B) indicate the maximal length of ISVs in various groups. Bars = 50 μm. Quantification of the average ISV length ± SEM in 24 hpf embryos (n = 12–68 embryos/group).(C) Quantification of the average ISV length ± SEM in 24 hpf embryos from the experiment shown in (A) (average n = 36 embryos/group).(D) Zebrafish vegf promoter activity as measured by average luciferase activity ± SEM in zebrafish embryos exposed to LD or LL (n = 20 embryos/group).(E) Zebrafish vegf promoter activity in scrambled or bmal1 morpholino-treated zebrafish embryos as measured by average luciferase activity ± SEM (n = 20 embryos/group).(F) Human vegf promoter activity in scrambled or bmal1 morpholino-treated zebrafish embryos as measured by average luciferase activity ± SEM (n = 20 embryos/group).(G–H) Values of average relative luciferase activity ± SEM in embryos exposed to LD, LL, or DD. Black line: Luciferase activity in zebrafish embryos injected with human vegf promoter-luciferase (G) or zebrafish vegf promoter-luciferase (H). Red lines in G represent luciferase activity in zebrafish embryos injected with a mouse bmal1 promoter-luciferase reporter plasmid.(I) qPCR analysis of average ± SEM endogenous levels of bmal1 (red line) and vegf (black line) under LD, LL, and DD conditions.(J) Sequence analysis of human, mouse, and zebrafish vegf promoter regions that contain E-boxes that bind to Bmal1. Red boxes represent the known Bmal1 binding E-boxes, and white boxes represent unknown binding E-boxes.(K) Schematic diagram showing various deleted mutants of the zebrafish vegf promoter region. ptr, promoter.(L) Average luciferase activity ± SEM in embryos injected with various deleted mutants of the zebrafish vegf promoter-luciferase and subsequently raised under LD exposure (n = 20 embryos/group).(M) ChIP assay of average Bmal1 binding ± SEM to the zebrafish vegf promoter. EB, E-box. p < 0.05; p < 0.01; and p < 0.001. NS, not significant.See also Figures S3 and S4. EXPRESSION / LABELING:
PHENOTYPE:
|

Involvement of the Notch Signaling Pathway in Circadian Clock-Regulated Vascular Sprouting(A) Zebrafish embryos received bmal1 (B1MO, 0.2 pmol/embryo), period2 (P2MO, 0.2 pmol/embryo) or vegf (VEGFMO, 0.1 pmol/embryo) morpholinos, either alone or in combination with DAPT (100 μM), rbpsuh morpholino (RbpsuhMO, 0.1 pmol/embryo), or in the mind-bomb background. The embryos were subsequently raised under the LD condition. Arrows point to ISV braches in each group. Scale bar is 100 μm.(B) Quantification of the average ± SEM. ISV density or number of branches/segment of 72 hpf embryos in (A) (average n = 23 embryos/group).(C) Zebrafish embryos received period2 (P2MO, 0.2 pmol/embryo) alone or in combination with DAPT (100 μM), rbpsuh morpholino (RbpsuhMO, 0.1 pmol/embryo), or in the mind-bomb background. The embryos were subsequently raised under LD or LL conditions. Arrows point to ISV braches in each group. Scale bar is 100 μm.(D) Quantification of the average ± SEM. ISV density or number of branches/segment of 72 hpf embryos in (C) (average n = 23 embryos/group). p < 0.05; p < 0.001; and p < 0.001. NS, not significant. EXPRESSION / LABELING:
PHENOTYPE:
|

Knockdown Efficiency of Morpholinos, Related to Figure 2.(A) Immunohistochemistry of clock gene mRNA-injected zebrafish embryos with or without morpholinos. The translated proteins were detected using an anti-myc tag antibody, followed by detection with an alkaline phosphatase-conjugated secondary antibody. The translated positive signals were revealed using the NBT/BCIP technique. Blue color shows positive signals of the translated proteins.(B) Quantifications of average clock protein levels ± SEM in mRNA-injected zebrafish embryos (18-24 embryos/group). |

Morphology and Expression Patterns of Sonic Hedgehog and Acetylated Tubulin in Zebrafish Embryos, Related to Figures 1 and 2 Zebrafish embryos at the 1–2 cell stage received injections of specific morpholinos targeting Bmal1 (B1MO), or Period2 (P2MO) (0.2 pmol/embryo) and subsequently raised under LL or LD conditions. Scrambled morpholino (scrMO, 0.2 pmol/embryo), 5 base–pair mismatch bmal1 (B1misMO, 0.2 pmol/embryo), and 5 base–pair mismatch period2 (P2misMO, 0.2 pmol/embryo) were used as controls. Expression of sonic hedgehog (shh) at 24 or 48 hpf was detected by in situ hybridization. Expression of acetylated tubulin (Ac–Tub) was detected by immunohistochemistry using a specific anti Ac–Tub antibody. NC = notochord; EN = enteric nerve. |

Additive Effect on Suppression of Developmental Angiogenesis by a Bmal1 Morpholino and Sunitinib, Related to Figure 3(A) Tg(Fli1:egfp)y1 zebrafish embryos were injected with scrambled control (scrMO), bmal1 (B1MO) or period2 (P2MO) mopholinos (0.2 pmol/embryo), and placed in medium with either the vehicle buffer or sunitinib. ISV development was investigated at 24 hpf. Scale bar = 50 μm.(B) Quantification of the average ISV length ± SEM of 24–hpf embryos (n = 4 embryos/group). |

RT-PCR Analysis of Circadian Rhythm of Zebrafish bmal1 and vegf Expression, Related to Figure 3(A) RT-PCR analysis of zebrafish bmal1 and vegf expression under LD conditions (a pooled sample of 25 zebrafish embryos/time point). Standard loading was indicated by β-actin expression.(B) Densitometric quantification of average ± SEM bmal1 and vegf expressions shown in (A). |