
- Title
-
Whole Plant Based Treatment of Hypercholesterolemia with Crataegus laevigata in a Zebrafish Model
- Authors
- Littleton, R.M., Miller, M., and Hove, J.R.
- Source
- Full text @ BMC Complement. Altern. Med.

BODIPY-cholesterol (BOD-CH) vs. NBD-cholesterol (NBD-CH). A. Green is BOD-CH and NBD-CH fluorescence. Arrows point to fluorescent deposits in vasculature. Top panel: 0% HCD + 10 μg/g BOD-CH vs. 4% HCD + 10 μg/g BOD-CH. Bottom panel: 0% HCD + 10 μg/g NBD-CH vs. 4% HCD + 10 μg/g NBD-CH B. 0% HCD + 10 μg/g BODIPY-CH shows significantly less fluorescent output than 4% HCD + 10 μg/g BOD-CH (*P < 0.05, Student′s t-test. n = 12 in each group) C. 4% HCD + 10 μg/g NBD-CH is not different from 0% HCD + 10 μg/g NBD-CH D. Dose response: BOD-CH fluorescence vs. percent cholesterol in diet. 0.5-8% HCD + 5-80μg/g BOD-CH (R = 0.912, R2 = 0.83). 1-way ANOVA with Holm-Sidak multiple comparison indicates statistically significant difference between each group and every other group (P < 0.05, n = 11-12 in each group) E. Dose response: NBD-CH fluorescence vs. percent cholesterol in diet (R = 0.811, R2 = 0.657). Each group is significantly different from all others (P < 0.05, 1-way ANOVA, Holm-Sidak multiple comparison. n = 10-12 in each group) except 0.5, 1 and 2% which are not significantly different from each other in any combination. |
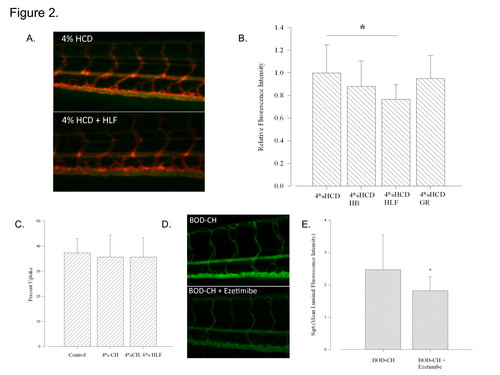
Hawthorn Leaves and Flowers (HLF) Decrease BODIPY-cholesterol fluorescence in 4%HCD-fed fish. A. Representative images of the vasculature of fish in 4%HCD and 4%HCD + HLF treated fish. Orange vasculature from TG(Kdrl:mCherry)/Casper line. Green is intravascular BOD-CH fluorescence B. Fluorescence output comparison between groups. Analyzed relative to mean of 4% HCD group having a value of 1. Significant difference between HLF and 4%HCD treated fish. * P < 0.05, bars are mean ± S.D. 1-way ANOVA, Holm-Sidak post-hoc multiple comparison. n = 15-17 per group. C. Comparison of percent uptake between untreated (control), CH-treated, and CH + HLF-treated diets. Five in each experimental group, with the experiment repeated 3x, showed similar uptake (P = 0.925, bars are mean ± S.D. of repeated experiments. 1-way ANOVA). D. Representative Images of BOD-CH treated and BOD-CH + Ezetimibe treated fish (4 dpf). E. Ezetimibe treatment decreases intravascular BOD-CH fluorescence (* P < 0.05, bars are mean ± S.D. 1-way ANOVA, Holm-Sidak post-hoc multiple comparison. n = 13-14 per group). EXPRESSION / LABELING:
|

Cardiac Output (CO) Decreases with Increasing Cholesterol (CH) Dose. A. Measurement of ventricular diastole and systole in TG(Kdrl:mCherry)/Casper transgenic to derive stroke volume (SV) in order to finally calculate CO B. CO decreases with increasing CH dose from 0.1-8%HCD (R = 0.397, R2 = 0.158). Difference between 0.1% and 8%HCD effect on CO is significant C. SV also decreases with increasing CH dose from 0.1-8%HCD (R = 0.396, R2 = 0.157). Difference between 0.1% and 8%HCD effect on SV is significant C. There is not a relationship between HR and CH dose. * P < 0.05, points are mean ± S.D. 1-way ANOVA, Holm-Sidak post-hoc analysis. n = 12-13 per group. |